Objective and use case
What you’ll build: A simple LC high‑pass filter for basic RF (tens of kHz to a few MHz) with a signal source and a resistive load, and you’ll measure its frequency response.
What it’s for
- Filtering low‑frequency noise (50/60 Hz hum) on a low‑power RF line.
- Separating the signal from a small antenna from the slow noise generated by the power supply.
- Pre‑filtering the input of a homebrew AM receiver to reduce audio interference.
- Cleaning up the output of an RF generator before amplifying it in the next stage.
- Measuring the real behavior of inductors (series resistance, parasitic capacitances) in a specific frequency band.
Expected result
- Very reduced output voltage for low frequencies (for example, 1 kHz: attenuation >20 dB with respect to the input).
- Output voltage close to the input for high frequencies (for example, >100 kHz: |Vout| > 0.9·|Vin|, depending on the values of L and C).
- Gain curve |Vout/Vin| that increases with frequency until it stabilizes near 1 (0 dB) in the passband.
- Measurable cutoff frequency where |Vout| ≈ 0.707·|Vin| (−3 dB), consistent with the theoretical value calculated from L, C, and the load resistance.
Target audience: RF hobbyists, analog electronics and radio students; Level: Beginner–intermediate (with basic notions of RLC and oscilloscope).
Architecture/flow: RF signal source → LC high‑pass filter (inductor + capacitor configured as a first‑order filter) → load resistor → measurement of Vout with oscilloscope or AC multimeter, sweeping frequency to obtain the gain curve.
Materials
- 1 × Function generator (able to reach at least 500 kHz or 1 MHz).
- 1 × Oscilloscope (preferably 2 channels, bandwidth ≥ 20 MHz).
- 1 × Inductor [L1] of 100 µH (or a nearby value between 47 µH and 220 µH).
- 1 × Capacitor [C1] of 1 nF (ceramic, preferably NP0/C0G type for basic RF).
- 1 × Resistor [R1] of 1 kΩ (¼ W).
- 1 × Breadboard (test board).
- 4–6 × Male‑male jumper wires.
- 1 × Power supply for the generator (if it does not have an internal one).
- 1 × Clip or cable for the oscilloscope GND reference.
(You can adjust the values of L1 and C1; the goal is for the cutoff frequency fc ≈ 1 / (2π·√(L·C)) to fall in a range where your generator and oscilloscope operate comfortably.)
Wiring guide
- Connect the ground (GND) of the function generator to the GND reference of the breadboard.
- Connect the GND clip of the oscilloscope to the same GND point on the breadboard.
- Connect the signal output of the generator (Vin) to a node on the breadboard that we’ll call VIN node.
- Connect channel 1 of the oscilloscope (CH1) to the VIN node to view the input signal.
- Connect the inductor [L1] between the VIN node and a new node that we’ll call VOUT node.
- Connect the capacitor [C1] between the VOUT node and GND.
- Connect the resistor [R1] between the VOUT node and GND (this will be the load of the filter).
- Connect channel 2 of the oscilloscope (CH2) to the VOUT node to view the output signal.
- Verify that there is no other component or wire directly connecting VIN node to GND or VOUT node to VIN node without going through [L1], nor to GND without going through [C1] or [R1].
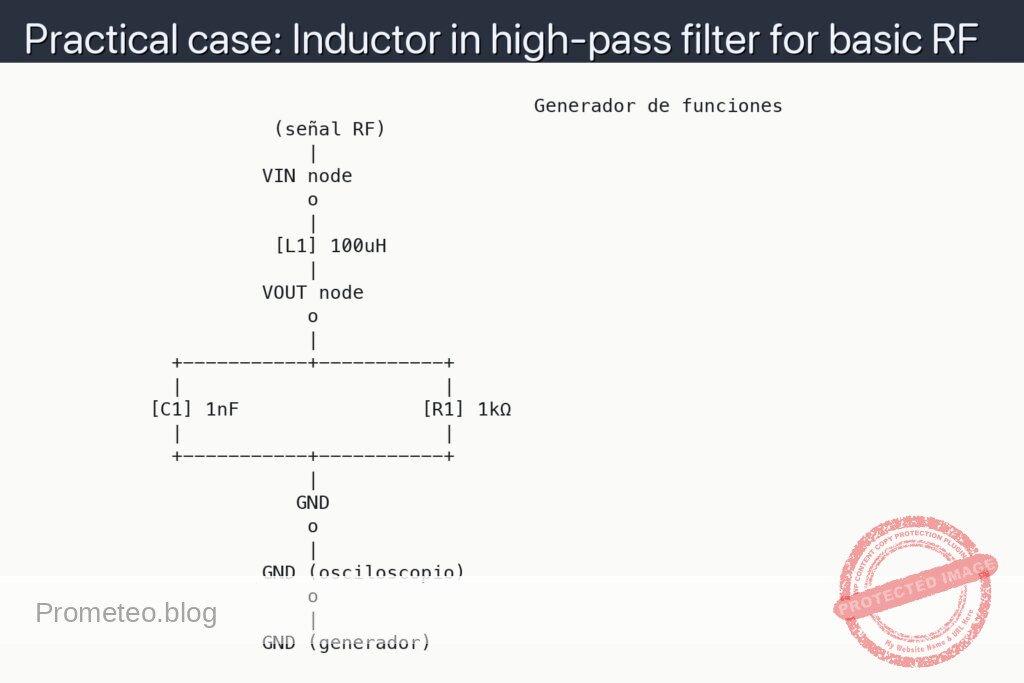
Schematic
                                             Generador de funciones
                      (señal RF)
                         |
                     VIN node
                         o
                         |
                      [L1] 100uH
                         |
                     VOUT node
                         o
                         |
             +-----------+-----------+
             |                       |
           [C1] 1nF                [R1] 1kΩ
             |                       |
             +-----------+-----------+
                         |
                        GND
                         o
                         |
                     GND (osciloscopio)
                         o
                         |
                     GND (generador)
Measurements and tests
-
Initial setup:
- Set the function generator to a sine wave of 1 Vpp amplitude (peak‑to‑peak) and 0 V offset (centered at 0).
- Connect CH1 of the oscilloscope to the VIN node and CH2 to the VOUT node, both referenced to GND.
- Configure the oscilloscope to see both signals superimposed (dual mode or XY mode if you want to compare phase).
-
Measurement of input amplitude (Vin):
- Adjust the CH1 scale so that the sine wave occupies a good portion of the screen.
- Measure the input amplitude, which we’ll call V_in_pp (input peak‑to‑peak voltage): it is the difference between the maximum peak and the minimum peak of the signal on CH1.
- Verify that V_in_pp remains approximately constant (for example, near 1 Vpp) when changing the frequency on the generator.
-
Measurement of output amplitude (Vout):
- Observe the CH2 signal and measure its peak‑to‑peak voltage, which we’ll call V_out_pp.
- Calculate the magnitude gain as |H(f)| = V_out_pp / V_in_pp.
- For greater accuracy, use the oscilloscope’s automatic measurement functions (Vpp measurement on each channel).
-
Frequency sweep:
- At low frequency (for example, 1 kHz):
- Set the generator to 1 kHz.
- Measure V_in_pp and V_out_pp. You should observe V_out_pp much smaller than V_in_pp.
- Near the theoretical cutoff frequency:
- Calculate the approximate cutoff frequency of the series‑parallel LC filter:
- fc ≈ 1 / (2·π·√(L·C)).
- With L1 = 100 µH and C1 = 1 nF ⇒ fc ≈ 503 kHz (approx.).
- Set the generator to frequencies around this value (for example, 100 kHz, 300 kHz, 500 kHz, 700 kHz, 1 MHz).
- At the frequency where V_out_pp ≈ 0.707·V_in_pp, you are approximately at the cutoff frequency (−3 dB).
- At high frequency (for example, > 1 MHz if your equipment allows it):
- Increase the frequency up to where your generator and oscilloscope work well (without too much distortion or loss).
- Measure V_out_pp; it should approach V_in_pp, that is, |H(f)| ≈ 1.
- At low frequency (for example, 1 kHz):
-
Measurement in dB (optional but recommended):
- The gain in decibels (dB) can be obtained with:
- Gain_dB = 20·log10(V_out_pp / V_in_pp).
- At low frequencies, large negative gain values in dB are expected (for example, −20 dB, −40 dB…), indicating strong attenuation.
- Around the cutoff frequency, approximately −3 dB is expected.
- At high frequencies, the gain should approach 0 dB.
Interpretation of the inductor’s behavior in the filter
- At low frequencies:
- The inductor [L1] behaves almost like a short (its reactance XL = 2·π·f·L is small).
- The signal sees the path from input to output through the inductor, but it encounters C1 and R1 to GND that “shunt” the signal to ground.
-
The result is that little voltage appears at VOUT node: the filter attenuates low frequencies (high‑pass behavior).
-
At high frequencies:
- XL increases with frequency, so the inductor looks more like a “large resistor” (high impedance).
- The capacitor [C1] at high frequency behaves with low reactance (XC = 1/(2·π·f·C) decreases with frequency) and together with R1 sets a reference point for the output.
-
The output node VOUT node sees less shunting to GND relative to the signal path, allowing the output voltage to be close to the input.
-
Role of resistor [R1]:
- R1 acts as the load of the filter and as a DC reference for capacitor C1.
- Without R1, the output node could be “floating” under some conditions and it would be hard to measure a stable output.
- The value of R1 affects the shape of the frequency response (Q, slope); for this basic case we use 1 kΩ as a typical value.
Common mistakes
- Incorrectly connecting the GND reference:
- If the generator GND is not tied to the oscilloscope GND, you’ll see strange waveforms or significant noise.
-
Always tie all grounds to a single common point.
-
Reversing the circuit connections:
- Although the ideal LC filter would be reversible in some cases, for this educational case strictly follow:
- Generator → [L1] → VOUT → [C1 and R1] → GND.
-
Do not place the capacitor in series nor the inductor to GND; that would be another filter topology.
-
Using unsuitable inductors:
- An iron‑core inductor designed for 50/60 Hz can behave poorly in RF (losses, saturation, parasitic resonances).
-
Prefer small inductors, air‑core type or ferrite cores suitable for RF.
-
Using very long wires:
- At frequencies of hundreds of kHz or more, long wires introduce appreciable parasitic inductances and capacitances.
- Keep connections as short and tidy as possible so as not to distort the result.
Possible improvements and variants
- Changing the cutoff frequency:
- If you want a lower fc, increase L1 or C1 (or both).
- If you want a higher fc, decrease L1 or C1.
-
Always recalculate: fc ≈ 1 / (2·π·√(L·C)).
-
Measuring phase as well as amplitude:
- Use the XY mode of the oscilloscope or measure the time difference between zero‑crossings of Vin and Vout.
-
The phase will show how the output leads or lags the input depending on frequency.
-
Adding more stages:
-
You can place another identical high‑pass filter in cascade (output of the first to the input of the second) to obtain a higher attenuation slope (extra 2nd order).
-
Trying other waveform types:
- Use a square wave and observe how the filter attenuates the low‑frequency component, modifying the shape of the output signal.
- Reason in terms of harmonic content and how the filter allows the higher‑frequency components to pass more.
With this setup you will have carried out a simple but very illustrative practical case of using an inductor in a high‑pass filter for basic RF, relating theory (inductance, reactance, cutoff frequency) with real measurements on the oscilloscope.
More Practical Cases at Prometeo.blog
Find this product and/or books on this topic on Amazon
As an Amazon affiliate, I earn from qualifying purchases. If you buy through this link, you help maintain this project.
Quick quiz
More Practical Cases on Prometeo.blog
Telecommunications Electronics Engineer and Computer Engineer (official degrees in Spain).