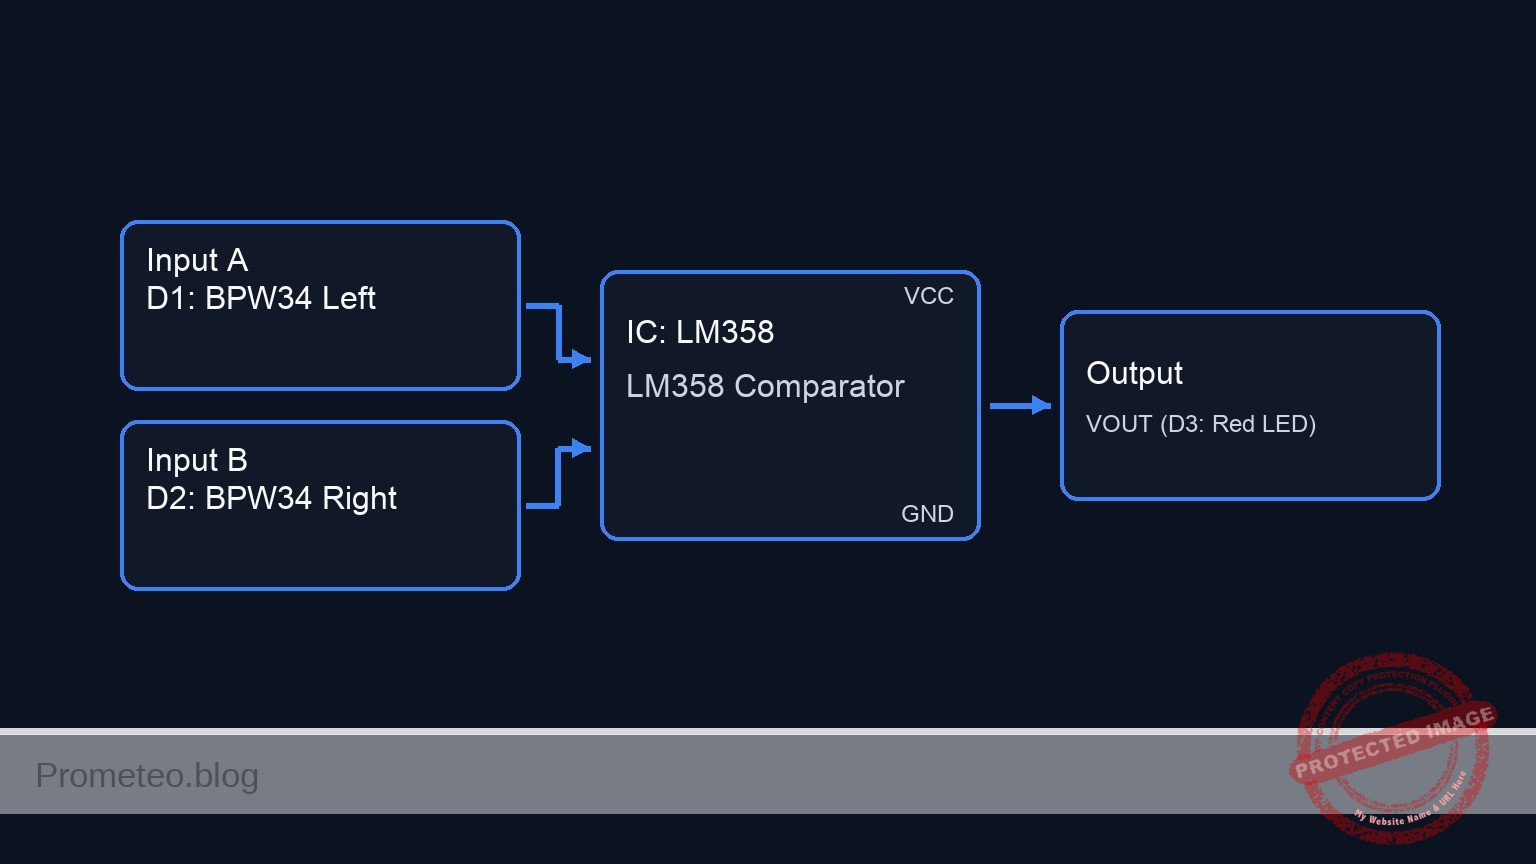
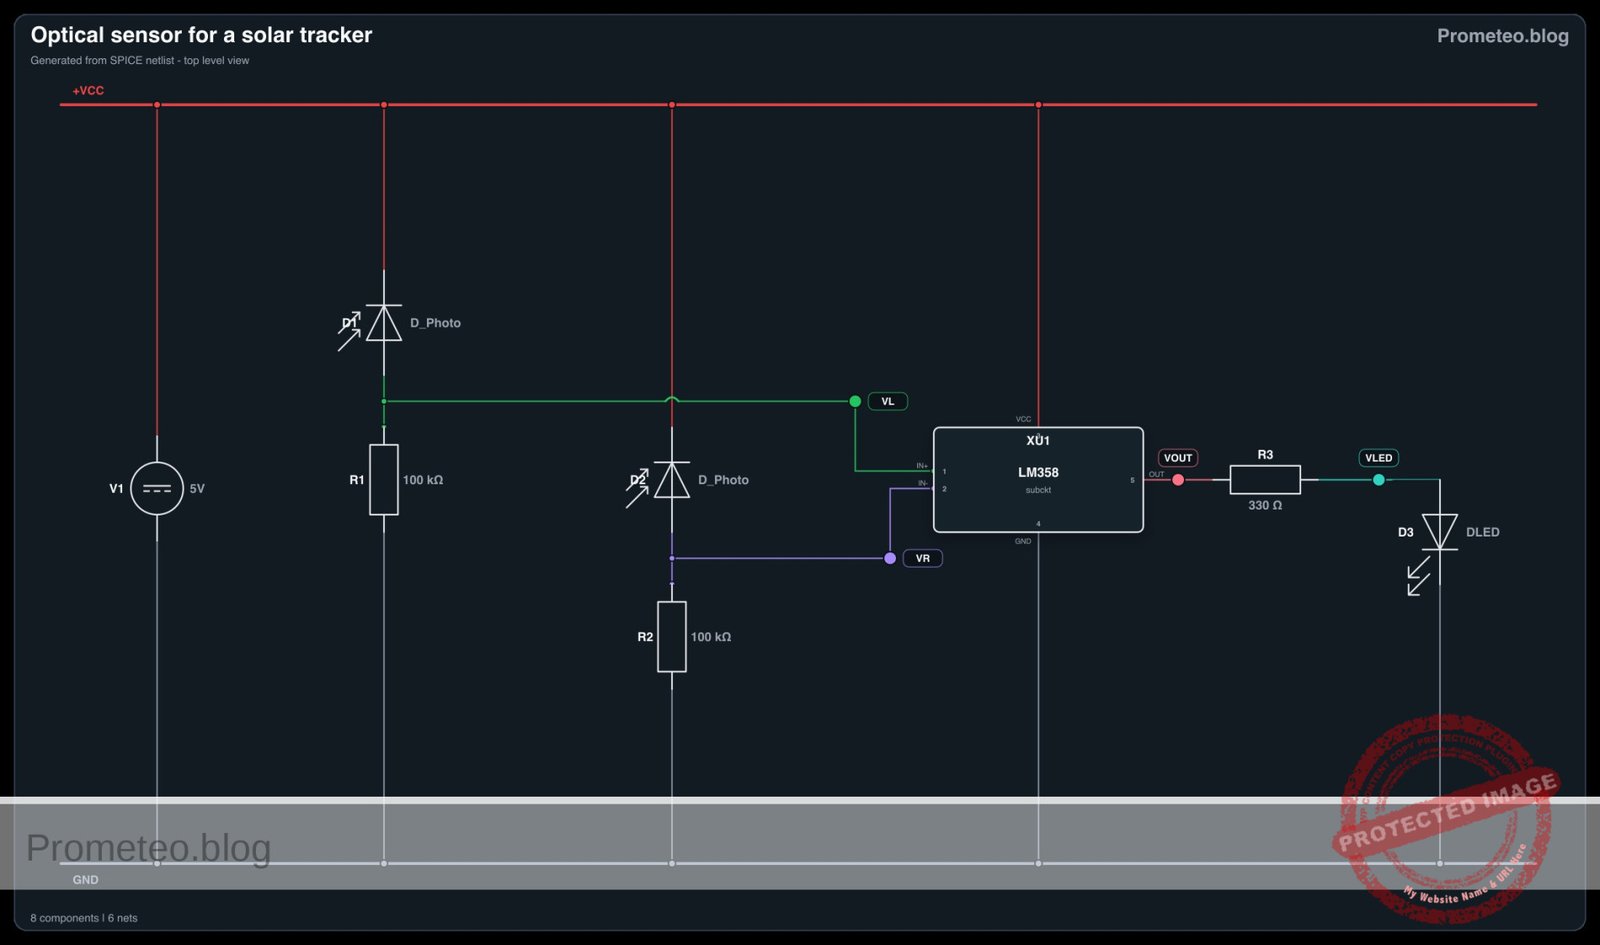
Practical case: Resonance in LC tank circuit

Level: Medium | Analyze the energy exchange and determine the resonant frequency of an AC-driven LC tank.

Objective and use case

In this practical case, you will build a parallel LC tank circuit driven by an AC sine wave source through a series resistor. By sweeping the input frequency, you will observe the precise point where inductive and capacitive reactances cancel out, maximizing the circuit’s impedance.

Understanding LC resonance is essential in modern electronics because these circuits are the fundamental building blocks of frequency selection. Real-world applications include:
* Radio frequency (RF) tuning: Selecting a specific station’s frequency while rejecting others.
* Audio and signal filtering: Creating band-pass or band-stop (notch) filters to eliminate noise.
* Wireless power transfer: Maximizing the efficiency of inductive coupling between transmitter and receiver coils.
* Oscillator circuits: Generating stable clock signals for microcontrollers and transceivers.

Expected outcome:
* You will calculate the theoretical resonant frequency based on the chosen $L$ and $C$ values.
* The total current drawn from the source (Itotal) will drop to its minimum value at resonance.
* The voltage across the LC tank (VLC) will peak at the resonant frequency.
* You will observe how energy continuously sloshes back and forth between the capacitor’s electric field and the inductor’s magnetic field.

Target audience: Intermediate electronics students transitioning from DC basics to AC reactive circuits.

Materials

  • V1: 5 V peak-to-peak AC voltage source, function: sine wave generator for frequency sweep
  • R1: 1 kΩ resistor, function: source impedance to allow voltage variations across the tank
  • L1: 10 mH inductor, function: magnetic energy storage
  • C1: 100 nF ceramic or film capacitor, function: electric energy storage

Wiring guide

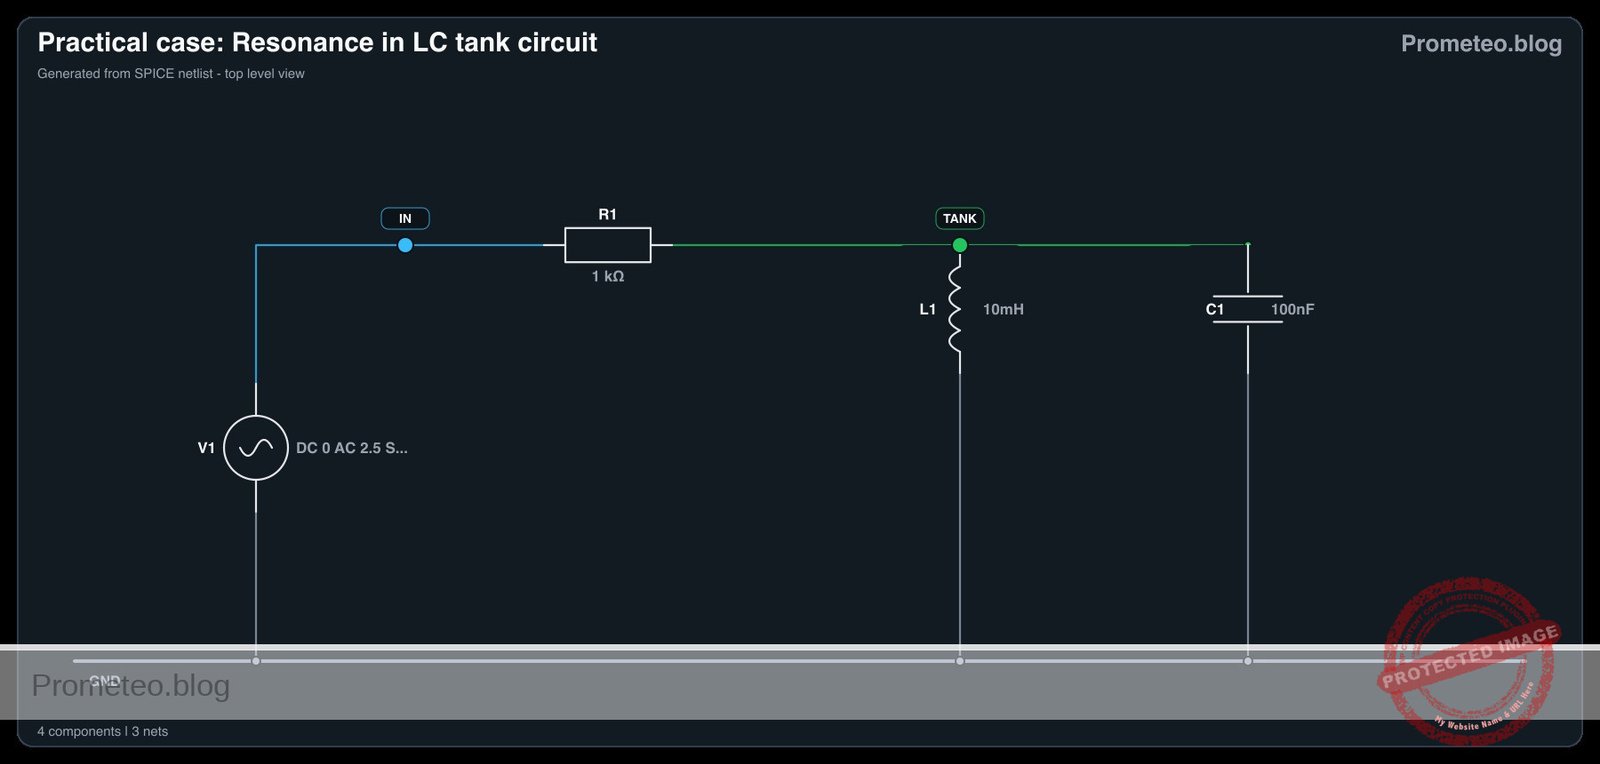
  • V1: Connect the positive terminal to node IN and the negative terminal to node 0 (GND).
  • R1: Connect one pin to node IN and the other pin to node TANK.
  • L1: Connect one pin to node TANK and the other pin to node 0 (GND).
  • C1: Connect one pin to node TANK and the other pin to node 0 (GND).

Conceptual block diagram
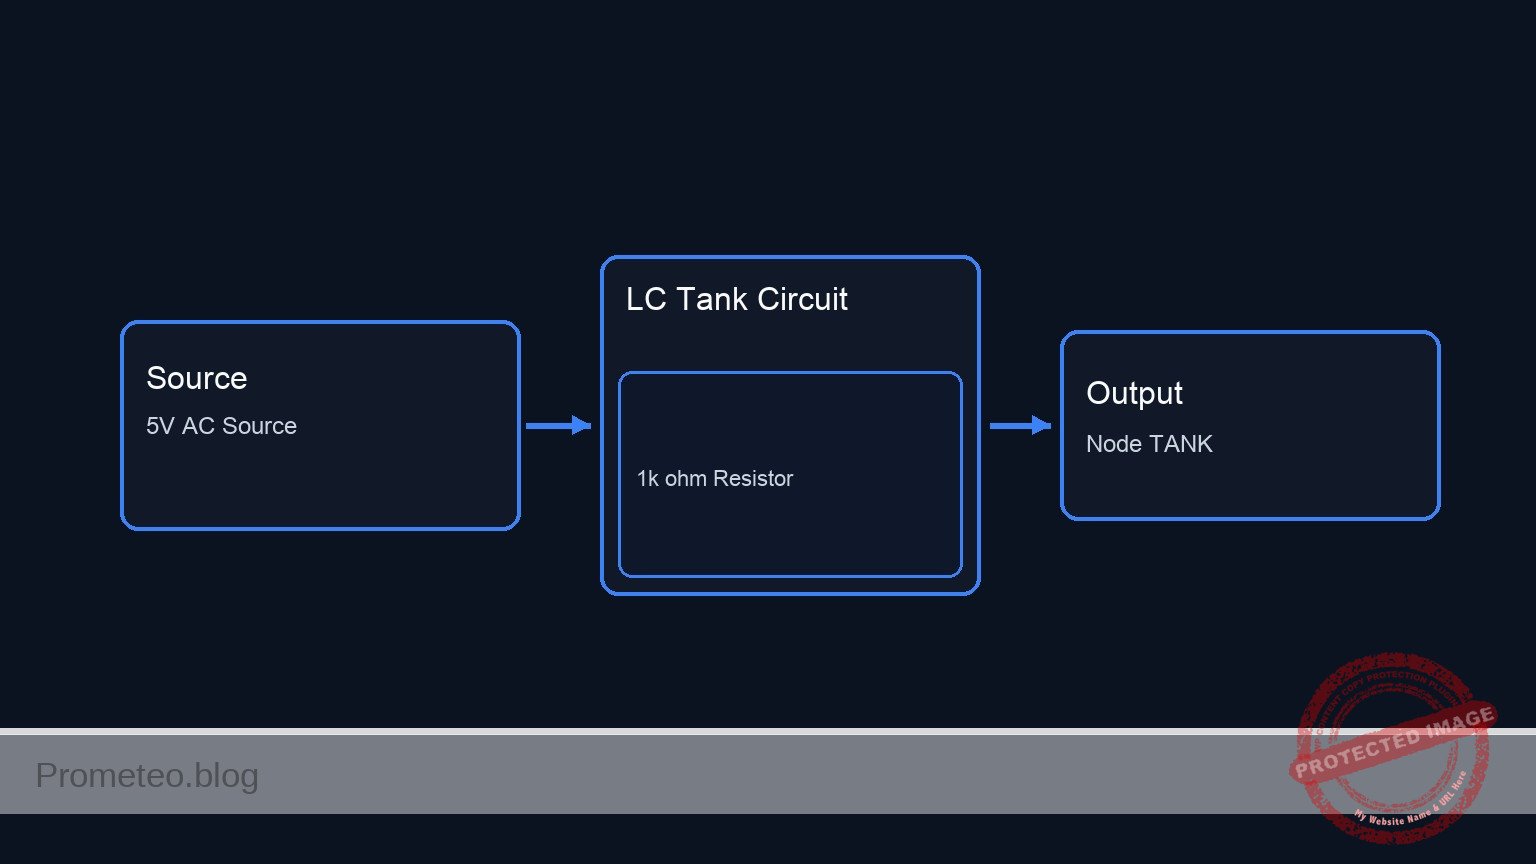
Conceptual block diagram — LC Tank Circuit
Quick read: inputs → main block → output (actuator or measurement). This summarizes the ASCII schematic below.

Schematic

[ V1: 5 V AC ] --(IN)--> [ R1: 1k ohm ] --(Node TANK)--+--> [ L1: 10mH ] --> GND
                                                      |
                                                      +--> [ C1: 100nF ] --> GND
Electrical Schematic

Electrical diagram

Electrical diagram for case: Practical case: Resonance in LC tank circuit
Generated from the validated SPICE netlist for this case.

🔒 This electrical diagram is premium. With the monthly membership (7-day free trial) you can unlock the complete didactic material and the print-ready PDF pack.🔓 See premium access plans

Measurements and tests

  1. Calculate the theoretical resonant frequency (fr):
    Use the formula fr = (1 / 2\pi\sqrtLC). With L = 10 mH and C = 100 nF, the expected resonant frequency is approximately 5032 Hz.
  2. Set up the frequency sweep:
    Configure V1 to output a 5 V peak-to-peak sine wave. Begin with a frequency of 1 kHz and gradually increase it up to 10 kHz.
  3. Measure VLC (Tank Voltage):
    Monitor the voltage amplitude at node TANK relative to node 0 (GND) using an oscilloscope or an AC voltmeter. As you approach 5 kHz, the voltage amplitude will rise steadily, hitting a sharp maximum exactly at resonance, and then fall as the frequency increases further.
  4. Measure Itotal (Source Current):
    Measure the current flowing through R1 (this can be done by observing the voltage difference between IN and TANK and applying Ohm’s law: Itotal = ((VIN – VTANK) / R1)). Note that at resonance, the parallel LC tank exhibits maximum impedance, meaning Itotal will drop to its minimum.
  5. Calculate the circuit’s Q-factor:
    Identify the -3dB (half-power) frequencies above and below the resonance peak to find the bandwidth ($BW$). The Quality Factor is Q = (fr / BW).

SPICE netlist and simulation

Reference SPICE Netlist (ngspice) — excerptFull SPICE netlist (ngspice)

* Practical case: Resonance in LC tank circuit
.width out=256

* 5V peak-to-peak implies an amplitude of 2.5V. 
* The resonant frequency of 10mH and 100nF is approximately 5033 Hz.
* We configure V1 with both a transient sine wave at resonance and an AC magnitude for optional AC analysis.
V1 IN 0 DC 0 AC 2.5 SIN(0 2.5 5033)

* Source impedance
R1 IN TANK 1k

* LC Tank circuit components
L1 TANK 0 10mH
* ... (truncated in public view) ...

Copy this content into a .cir file and run with ngspice.

🔒 Part of this section is premium. With the monthly membership (7-day free trial) you can access the full content (materials, wiring, detailed build, validation, troubleshooting, variants and checklist) and download the complete print-ready PDF pack.

* Practical case: Resonance in LC tank circuit
.width out=256

* 5V peak-to-peak implies an amplitude of 2.5V. 
* The resonant frequency of 10mH and 100nF is approximately 5033 Hz.
* We configure V1 with both a transient sine wave at resonance and an AC magnitude for optional AC analysis.
V1 IN 0 DC 0 AC 2.5 SIN(0 2.5 5033)

* Source impedance
R1 IN TANK 1k

* LC Tank circuit components
L1 TANK 0 10mH
C1 TANK 0 100nF

* Operating point and Transient analysis
.op
.tran 1u 2m

* Print directives for logging the input and output (resonance) nodes
.print tran V(IN) V(TANK) I(L1)

.end

Simulation Results (Transient Analysis)

Simulation Results (Transient Analysis)
Analysis: The transient simulation shows the input voltage V(IN) oscillating as a sine wave with a 2.5V amplitude (5V peak-to-peak). The voltage at the tank node V(TANK) closely follows V(IN) with nearly the same amplitude, and the inductor current oscillates, confirming the resonant behavior of the LC tank circuit at the specified frequency.
Show raw data table (2015 rows)
Index   time            v(in)           v(tank)         l1#branch
0	0.000000e+00	0.000000e+00	0.000000e+00	0.000000e+00
1	1.000000e-08	7.905818e-04	7.905026e-08	7.905026e-14
2	1.084006e-08	8.569951e-04	8.624878e-08	8.629565e-14
3	1.252017e-08	9.898217e-04	1.017615e-07	1.020896e-13
4	1.588039e-08	1.255475e-03	1.394809e-07	1.426210e-13
5	2.260084e-08	1.786781e-03	2.416948e-07	2.707046e-13
6	3.604174e-08	2.849394e-03	5.532131e-07	8.049184e-13
7	5.708432e-08	4.512980e-03	1.327631e-06	2.783809e-12
8	8.603868e-08	6.802053e-03	2.965106e-06	8.998482e-12
9	1.305078e-07	1.031768e-02	6.769425e-06	3.064276e-11
10	1.955195e-07	1.545732e-02	1.514065e-05	1.018634e-10
11	2.946313e-07	2.329267e-02	3.431881e-05	3.469641e-10
12	4.417944e-07	3.492633e-02	7.707420e-05	1.166612e-09
13	6.644501e-07	5.252635e-02	1.741480e-04	3.963414e-09
14	9.972436e-07	7.882720e-02	3.917455e-04	1.337970e-08
15	1.499113e-06	1.184727e-01	8.834917e-04	4.537981e-08
16	2.252017e-06	1.778899e-01	1.987598e-03	1.534626e-07
17	3.252017e-06	2.566456e-01	4.126641e-03	4.591745e-07
18	4.252017e-06	3.351447e-01	7.022468e-03	1.016630e-06
19	5.252017e-06	4.133086e-01	1.066173e-02	1.900840e-06
20	6.252017e-06	4.910592e-01	1.502968e-02	3.185410e-06
21	7.252017e-06	5.683189e-01	2.011023e-02	4.942405e-06
22	8.252017e-06	6.450102e-01	2.588597e-02	7.242215e-06
23	9.252017e-06	7.210565e-01	3.233820e-02	1.015342e-05
... (1991 more rows) ...


Reference SPICE netlist (ngspice)

* Practical case: Resonance in LC tank circuit
.width out=256

* 5V peak-to-peak implies an amplitude of 2.5V.
* The resonant frequency of 10mH and 100nF is approximately 5033 Hz.
* We configure V1 with both a transient sine wave at resonance and an AC magnitude for optional AC analysis.
V1 IN 0 DC 0 AC 2.5 SIN(0 2.5 5033)

* Source impedance
R1 IN TANK 1k

* LC Tank circuit components
L1 TANK 0 10mH
C1 TANK 0 100nF

* Operating point and Transient analysis
.op
.tran 1u 2m

* Print directives for logging the input and output (resonance) nodes
.print tran V(IN) V(TANK) I(L1)

.end

Simulation Results (Transient Analysis)

Simulation Results (Transient Analysis)
Analysis: The transient simulation shows the input voltage V(IN) oscillating as a sine wave with a 2.5V amplitude (5V peak-to-peak). The voltage at the tank node V(TANK) closely follows V(IN) with nearly the same amplitude, and the inductor current oscillates, confirming the resonant behavior of the LC tank circuit at the specified frequency.

Common mistakes and how to avoid them

  • Using a polarized capacitor in an AC circuit: Electrolytic capacitors are generally polarized and can fail or explode if subjected to reversing AC voltages. Always use non-polarized capacitors (like ceramic or film) for an LC tank.
  • Ignoring the inductor’s Equivalent Series Resistance (ESR): Real inductors consist of long coils of wire, adding parasitic DC resistance to the tank. If the measured Q-factor is much lower than expected (resulting in a wider, flatter peak), inductor ESR is usually the culprit.
  • Confusing angular frequency (\omega) with standard frequency ($f$): Remember that \omega = (1 / \sqrtLC) yields results in radians per second. You must divide by 2\pi to get the frequency in Hertz.

Troubleshooting

  • Symptom: The measured resonant frequency is significantly higher or lower than the calculated 5032 Hz.
    • Cause: Component tolerances. Standard ceramic capacitors can have a ±20% tolerance, and inductors often have ±10%.
    • Fix: Measure the exact values of L1 and C1 using an LCR meter and recalculate the expected frequency.
  • Symptom: VLC shows no noticeable peak during the sweep; the voltage remains relatively flat.
    • Cause: The chosen frequency sweep range does not cover the resonant point, or R1 is too small, effectively shorting the tank to the rigid voltage source.
    • Fix: Double-check the math for your specific $L$ and $C$ values to ensure the sweep range encompasses fr. Ensure R1 is adequately sized (1 kΩ is a good starting point).
  • Symptom: Signal distortion or clipping is observed at node TANK.
    • Cause: The AC source might be overdriving the circuit, or core saturation is occurring in the inductor (if using a very small ferrite core at high currents).
    • Fix: Reduce the amplitude of V1 from 5 V to 1 V peak-to-peak and check if the sine wave becomes clean again.

Possible improvements and extensions

  • Vary the damping resistor: Swap R1 for different values (e.g., 470 Ω, 10 kΩ) or add a resistor directly in parallel with the LC tank. Observe and chart how this affects the sharpness of the resonance peak (the Q-factor).
  • Build an active oscillator: Remove the AC source and connect the LC tank to a transistor or an op-amp with positive feedback (such as a Colpitts or Hartley configuration) to create a standalone circuit that generates its own continuous sine wave at the resonant frequency.

More Practical Cases on Prometeo.blog

Find this product and/or books on this topic on Amazon

Go to Amazon

As an Amazon Associate, I earn from qualifying purchases. If you buy through this link, you help keep this project running.

Quick Quiz

Question 1: What is the primary objective of sweeping the input frequency in the described LC tank circuit?


Question 2: In a parallel LC tank circuit at resonance, what happens to the total current drawn from the source?


Question 3: What happens to the voltage across the LC tank at the resonant frequency?


Question 4: How does energy behave in an LC tank circuit at resonance?


Question 5: Which of the following is a real-world application of LC resonance mentioned in the text?


Question 6: What is the function of the series resistor (R1) in this practical case?


Question 7: What type of source is used to drive the LC tank circuit in this practical case?


Question 8: In the context of audio and signal filtering, what can LC circuits be used to create?


Question 9: Why is understanding LC resonance essential for wireless power transfer?


Question 10: Who is the target audience for this practical case?


Carlos Núñez Zorrilla
Electronics & Computer Engineer

Telecommunications Electronics Engineer and Computer Engineer (official degrees in Spain).
Follow me:


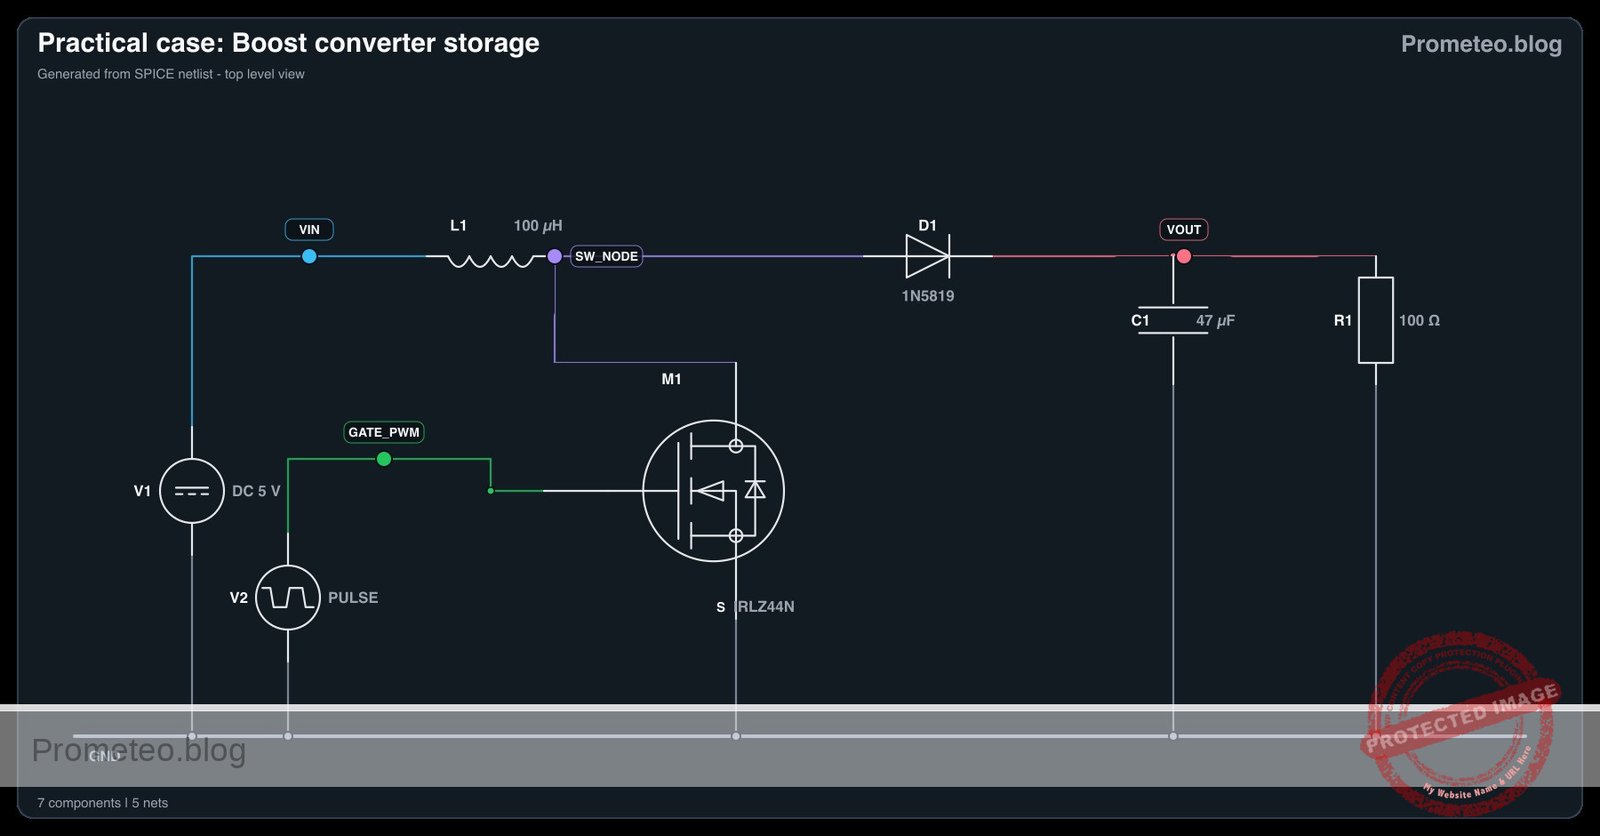
Practical case: Boost converter storage

Level: Medium | Understand magnetic energy storage to boost voltage.

Objective and use case

In this practical case, you will build a basic open-loop Boost converter to demonstrate how an inductor stores and releases magnetic energy to step up a DC voltage.

Why it is useful:
* Allows battery-powered devices to operate at higher voltages (e.g., generating 5 V from a single 3.7 V Li-ion cell).
* Drives strings of LEDs that require a constant, high forward voltage.
* Captures and steps up voltage in energy harvesting and regenerative braking systems.
* Provides versatile power rails in compact portable electronics without requiring multiple batteries.

Expected outcome:
* You will observe the inductor current (I_inductor) ramping up when the switch is closed and ramping down when it opens.
* The output voltage (V_out) will be demonstrably higher than the input voltage source.
* You will record the direct relationship between the switch’s Duty Cycle and the resulting V_out magnitude.

Target audience and level:
Intermediate electronics students learning the fundamentals of switch-mode power supplies.

Materials

  • V1: 5 V DC source, function: main power input
  • V2: Pulse voltage source (0-5 V, 100kHz, 50% duty cycle), function: PWM signal for the switch
  • L1: 100 µH inductor, function: magnetic energy storage
  • M1: N-channel MOSFET (e.g., IRLZ44N), function: main switching element
  • D1: Schottky diode (e.g., 1N5819), function: prevents reverse current from capacitor
  • C1: 47 µF capacitor, function: output voltage smoothing
  • R1: 100 Ω resistor, function: basic load to discharge capacitor

Wiring guide

  • V1: connects between VIN and 0 (GND).
  • V2: connects between GATE_PWM and 0 (GND).
  • L1: connects between VIN and SW_NODE.
  • M1: Drain connects to SW_NODE, Gate connects to GATE_PWM, Source connects to 0 (GND).
  • D1: Anode connects to SW_NODE, Cathode connects to VOUT.
  • C1: connects between VOUT and 0 (GND).
  • R1: connects between VOUT and 0 (GND).

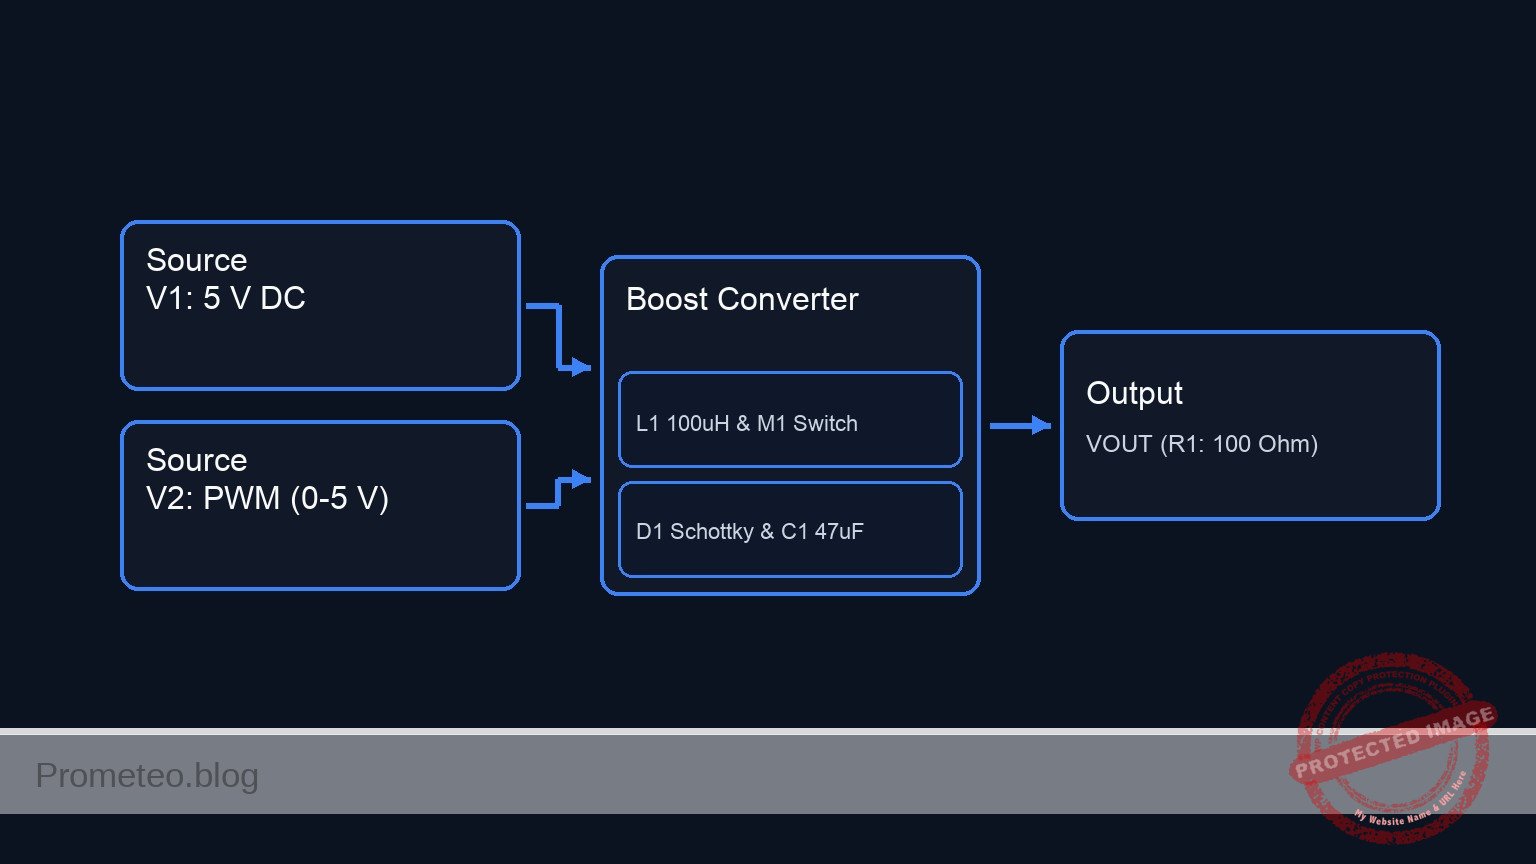
Conceptual block diagram

Conceptual block diagram — Boost Converter
Quick read: inputs → main block → output (actuator or measurement). This summarizes the ASCII schematic below.

Schematic

Control Signal:
[ V2: PWM (0-5 V) ] --(GATE_PWM)--> [ M1:Gate ]

Power & Switching Path:
[ V1: 5 V DC ] --(VIN)--> [ L1: 100µH ] --(SW_NODE)--> [ M1:Drain ] --(Switch)--> [ M1:Source ] --> GND
                                             |
Boost Output & Load:                         |
                                             +--> [ D1: Schottky ] --(VOUT)--> [ R1: 100 Ω ] --> GND
                                                                       |
                                                                       +--> [ C1: 47µF ] --> GND
Electrical Schematic

Electrical diagram

Electrical diagram for case: Practical case: Boost converter storage
Generated from the validated SPICE netlist for this case.

🔒 This electrical diagram is premium. With the monthly membership (7-day free trial) you can unlock the complete didactic material and the print-ready PDF pack.🔓 See premium access plans

Measurements and tests

  1. Initial state check: Apply V1 (5 V) with V2 turned off (0% duty cycle). Measure VOUT. The voltage should be roughly 4.7 V (the 5 V input minus the forward voltage drop of the Schottky diode).
  2. Switching activation: Activate V2 to supply a 100kHz square wave at a 50% duty cycle. Measure VOUT across R1. The voltage should rise to approximately 9 V-10 V, demonstrating the step-up action.
  3. Inductor current observation: Probe the current flowing through L1 (I_inductor). You will observe a triangular waveform. The upward slope occurs while M1 is ON (energy storage), and the downward slope occurs while M1 is OFF (energy release to VOUT).
  4. Duty Cycle mapping: Adjust the Duty Cycle of V2 from 30% to 70% in 10% increments. Record VOUT at each step to verify that a higher duty cycle yields a higher output voltage.

SPICE netlist and simulation

Reference SPICE Netlist (ngspice) — excerptFull SPICE netlist (ngspice)

* Boost converter storage

* Main power input
V1 VIN 0 DC 5

* PWM signal for the switch (100kHz, 50% duty cycle)
V2 GATE_PWM 0 PULSE(0 5 0 10n 10n 5u 10u)

* Magnetic energy storage
L1 VIN SW_NODE 100u

* Main switching element (N-channel MOSFET)
* Drain: SW_NODE, Gate: GATE_PWM, Source: 0, Bulk: 0
M1 SW_NODE GATE_PWM 0 0 IRLZ44N

* Prevents reverse current from capacitor
* Anode: SW_NODE, Cathode: VOUT
D1 SW_NODE VOUT 1N5819

* Output voltage smoothing
* ... (truncated in public view) ...

Copy this content into a .cir file and run with ngspice.

🔒 Part of this section is premium. With the monthly membership (7-day free trial) you can access the full content (materials, wiring, detailed build, validation, troubleshooting, variants and checklist) and download the complete print-ready PDF pack.

* Boost converter storage

* Main power input
V1 VIN 0 DC 5

* PWM signal for the switch (100kHz, 50% duty cycle)
V2 GATE_PWM 0 PULSE(0 5 0 10n 10n 5u 10u)

* Magnetic energy storage
L1 VIN SW_NODE 100u

* Main switching element (N-channel MOSFET)
* Drain: SW_NODE, Gate: GATE_PWM, Source: 0, Bulk: 0
M1 SW_NODE GATE_PWM 0 0 IRLZ44N

* Prevents reverse current from capacitor
* Anode: SW_NODE, Cathode: VOUT
D1 SW_NODE VOUT 1N5819

* Output voltage smoothing
C1 VOUT 0 47u

* Basic load to discharge capacitor
R1 VOUT 0 100

* Models
.model IRLZ44N NMOS(Level=1 VTO=2.0 KP=10.0 RS=0.05 RD=0.05)
.model 1N5819 D(IS=1e-6 RS=0.1 N=1.05 EG=0.69 XTI=2)

* Output Directives
* VOUT is the main output, GATE_PWM is the input stimulus
.print tran V(VOUT) V(GATE_PWM) V(SW_NODE) V(VIN) I(L1)

* Analysis
* Time constant is R*C = 4.7ms. Simulating for 10ms to observe steady-state boost voltage.
.op
.tran 0.1u 10m

.end

Simulation Results (Transient Analysis)

Simulation Results (Transient Analysis)
Analysis: The simulation shows the boost converter operating correctly. The output voltage (VOUT) starts near 5V and rises to a steady-state value of approximately 9.6V, with the switch node (SW_NODE) switching between ~0V and ~10V as driven by the 100kHz PWM signal.
Show raw data table (119800 rows)
Index   time            v(vout)         v(gate_pwm)     v(sw_node)      v(vin)          l1#branch
0	0.000000e+00	4.702912e+00	0.000000e+00	5.000000e+00	5.000000e+00	4.702912e-02
1	1.000000e-10	4.702912e+00	5.000000e-02	4.999798e+00	5.000000e+00	4.702912e-02
2	2.000000e-10	4.702912e+00	1.000000e-01	4.999798e+00	5.000000e+00	4.702912e-02
3	4.000000e-10	4.702912e+00	2.000000e-01	4.999797e+00	5.000000e+00	4.702912e-02
4	8.000000e-10	4.702912e+00	4.000000e-01	4.999797e+00	5.000000e+00	4.702912e-02
5	1.600000e-09	4.702912e+00	8.000000e-01	4.999797e+00	5.000000e+00	4.702912e-02
6	3.200000e-09	4.702912e+00	1.600000e+00	4.999797e+00	5.000000e+00	4.702913e-02
7	6.400000e-09	4.702910e+00	3.200000e+00	8.651034e-03	5.000000e+00	4.710899e-02
8	1.000000e-08	4.702907e+00	5.000000e+00	6.306948e-03	5.000000e+00	4.728872e-02
9	1.064000e-08	4.702906e+00	5.000000e+00	6.311218e-03	5.000000e+00	4.732068e-02
10	1.192000e-08	4.702905e+00	5.000000e+00	6.319746e-03	5.000000e+00	4.738460e-02
11	1.448000e-08	4.702902e+00	5.000000e+00	6.336800e-03	5.000000e+00	4.751244e-02
12	1.960000e-08	4.702897e+00	5.000000e+00	6.370908e-03	5.000000e+00	4.776811e-02
13	2.984000e-08	4.702887e+00	5.000000e+00	6.439123e-03	5.000000e+00	4.827946e-02
14	5.032000e-08	4.702866e+00	5.000000e+00	6.575553e-03	5.000000e+00	4.930212e-02
15	9.128000e-08	4.702825e+00	5.000000e+00	6.848406e-03	5.000000e+00	5.134738e-02
16	1.732000e-07	4.702743e+00	5.000000e+00	7.394086e-03	5.000000e+00	5.543754e-02
17	2.732000e-07	4.702643e+00	5.000000e+00	8.060152e-03	5.000000e+00	6.042981e-02
18	3.732000e-07	4.702543e+00	5.000000e+00	8.726166e-03	5.000000e+00	6.542142e-02
19	4.732000e-07	4.702443e+00	5.000000e+00	9.392128e-03	5.000000e+00	7.041236e-02
20	5.732000e-07	4.702343e+00	5.000000e+00	1.005804e-02	5.000000e+00	7.540264e-02
21	6.732000e-07	4.702243e+00	5.000000e+00	1.072390e-02	5.000000e+00	8.039225e-02
22	7.732000e-07	4.702143e+00	5.000000e+00	1.138970e-02	5.000000e+00	8.538119e-02
23	8.732000e-07	4.702043e+00	5.000000e+00	1.205546e-02	5.000000e+00	9.036947e-02
... (119776 more rows) ...


Reference SPICE netlist (ngspice)

* Boost converter storage

* Main power input
V1 VIN 0 DC 5

* PWM signal for the switch (100kHz, 50% duty cycle)
V2 GATE_PWM 0 PULSE(0 5 0 10n 10n 5u 10u)

* Magnetic energy storage
L1 VIN SW_NODE 100u

* Main switching element (N-channel MOSFET)
* Drain: SW_NODE, Gate: GATE_PWM, Source: 0, Bulk: 0
M1 SW_NODE GATE_PWM 0 0 IRLZ44N

* Prevents reverse current from capacitor
* Anode: SW_NODE, Cathode: VOUT
D1 SW_NODE VOUT 1N5819

* Output voltage smoothing
C1 VOUT 0 47u

* Basic load to discharge capacitor
R1 VOUT 0 100

* Models
.model IRLZ44N NMOS(Level=1 VTO=2.0 KP=10.0 RS=0.05 RD=0.05)
.model 1N5819 D(IS=1e-6 RS=0.1 N=1.05 EG=0.69 XTI=2)

* Output Directives
* VOUT is the main output, GATE_PWM is the input stimulus
.print tran V(VOUT) V(GATE_PWM) V(SW_NODE) V(VIN) I(L1)

* Analysis
* Time constant is R*C = 4.7ms. Simulating for 10ms to observe steady-state boost voltage.
.op
.tran 0.1u 10m

.end

Simulation Results (Transient Analysis)

Simulation Results (Transient Analysis)
Analysis: The simulation shows the boost converter operating correctly. The output voltage (VOUT) starts near 5V and rises to a steady-state value of approximately 9.6V, with the switch node (SW_NODE) switching between ~0V and ~10V as driven by the 100kHz PWM signal.

Common mistakes and how to avoid them

  • Using a standard rectifier diode (e.g., 1N4007): Standard diodes are too slow to turn off at 100kHz, leading to massive switching losses and poor voltage conversion. Always use a fast-recovery or Schottky diode like the 1N5819.
  • Inductor core saturation: If the inductor’s maximum current rating is lower than the peak switching current, the magnetic core will saturate. The inductor will then act as a short circuit, potentially destroying the MOSFET. Always verify the inductor’s saturation current rating.
  • Operating without a load: Running a boost converter with no load resistor (R1) can cause the output voltage to continuously rise with every switching cycle, theoretically reaching infinity and destroying the output capacitor or MOSFET. Always include a minimum load.

Troubleshooting

  • Symptom: Output voltage equals the input voltage (minus diode drop).
  • Cause: The MOSFET is not switching. V2 might be disconnected or the voltage level is too low to surpass the MOSFET’s gate threshold.
  • Fix: Check the GATE_PWM signal with an oscilloscope. Use a logic-level MOSFET if your PWM signal is limited to 3.3 V or 5 V.
  • Symptom: MOSFET becomes extremely hot very quickly.
  • Cause: The inductor is saturating, or the MOSFET has a high ON-resistance (RDS(on)) and is experiencing high conduction losses.
  • Fix: Swap the inductor for one with a higher current rating. Ensure the gate drive voltage is sufficient to turn the MOSFET completely ON.
  • Symptom: Unstable or highly rippled output voltage.
  • Cause: The output capacitor C1 is too small for the load or has a high Equivalent Series Resistance (ESR).
  • Fix: Increase the capacitance of C1 or place a ceramic capacitor in parallel with the electrolytic capacitor to lower the overall ESR.

Possible improvements and extensions

  • Closed-loop control: Add a voltage divider at the output connected to an error amplifier or microcontroller analog input. Dynamically adjust the PWM duty cycle to maintain a constant VOUT regardless of changes in R1 (the load).
  • Synchronous rectification: Replace the Schottky diode D1 with a second P-channel or driven N-channel MOSFET. Switching this second MOSFET synchronously (inversely to M1) reduces the voltage drop typical of a diode, significantly improving overall converter efficiency.

More Practical Cases on Prometeo.blog

Find this product and/or books on this topic on Amazon

Go to Amazon

As an Amazon Associate, I earn from qualifying purchases. If you buy through this link, you help keep this project running.

Quick Quiz

Question 1: What is the primary purpose of the Boost converter in this practical case?


Question 2: Which component is responsible for storing and releasing magnetic energy?


Question 3: What happens to the inductor current when the switch is closed?


Question 4: Which of the following is a mentioned use case for a Boost converter?


Question 5: What happens to the inductor current when the switch opens?


Question 6: What parameter of the switch has a direct relationship with the magnitude of the output voltage?


Question 7: How can a Boost converter benefit battery-powered devices?


Question 8: What role does the Boost converter play in energy harvesting systems?


Question 9: What is the expected relationship between the output voltage and the input voltage source?


Question 10: Who is the target audience for this practical case?


Carlos Núñez Zorrilla
Electronics & Computer Engineer

Telecommunications Electronics Engineer and Computer Engineer (official degrees in Spain).
Follow me:


Practical case: Inductive peak protection

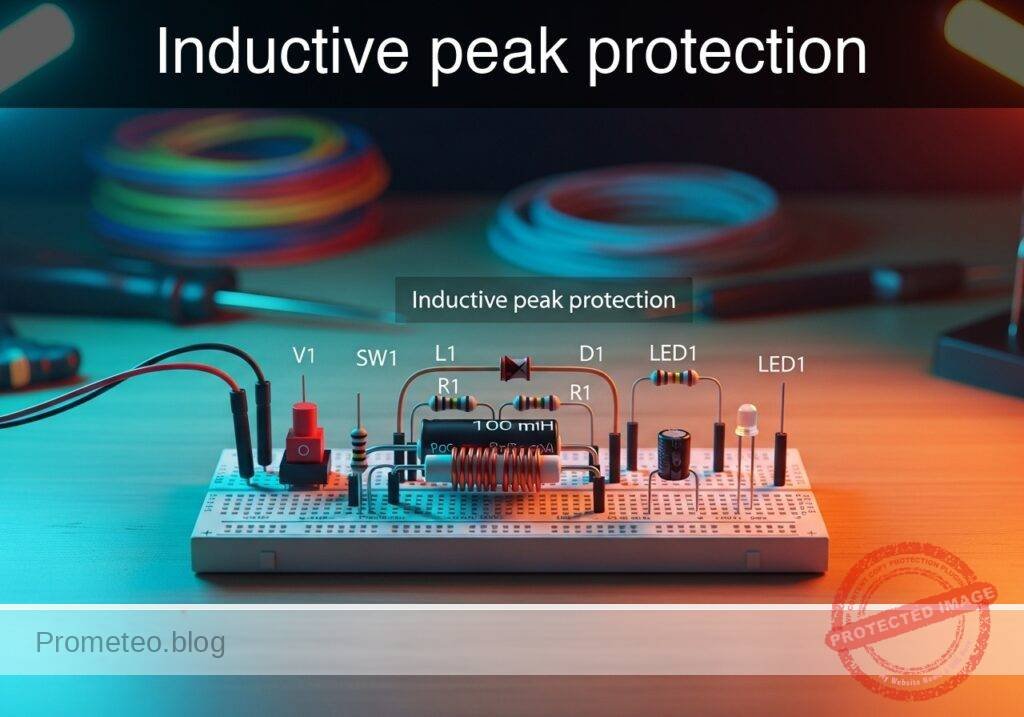
Inductive peak protection prototype (Maker Style)

Level: Medium | Objective: Analyze the transient voltage generated when disconnecting an inductor and mitigate it using a flyback diode.

Objective and use case

In this practical case, you will build a switched inductor circuit monitored by an oscilloscope to observe the destructive voltage spike (inductive kickback) that occurs when current is abruptly interrupted. You will then install a flyback diode in parallel with the inductive load to safely clamp this transient voltage.

Why it is useful:
* Prevents catastrophic overvoltage damage to sensitive switching components such as transistors, MOSFETs, and microcontroller pins.
* Significantly reduces electromagnetic interference (EMI) and radio frequency interference (RFI) caused by high-voltage arcing across mechanical switch contacts.
* Increases the reliability, safety, and lifespan of power supply systems, motor controllers, and relay-driven circuits.

Expected outcome:
* Without the diode, opening the switch will produce a massive negative voltage spike on the oscilloscope, often reaching hundreds of volts.
* With the flyback diode installed, the transient spike will be immediately clamped to a safe level of approximately -0.7 V.
* The stored magnetic energy will safely dissipate as a steadily decaying circulating current through the inductor-resistor-diode loop.

Target audience and level: Intermediate electronics students learning about reactive components, energy storage, and circuit protection techniques.

Materials

  • V1: 12 V DC supply, function: main power source
  • SW1: SPST toggle or push-button switch, function: circuit connection control
  • L1: 100 mH inductor, function: magnetic energy storage
  • R1: 100 Ω resistor, function: limits steady-state current to 120 mA
  • D1: 1N4007 rectifier diode, function: flyback protection

Wiring guide

  • V1: connects between node VCC (positive) and node 0 (ground).
  • SW1: connects between node VCC and node SW_OUT.
  • L1: connects between node SW_OUT and node L_MID.
  • R1: connects between node L_MID and node 0.
  • D1: connects between node 0 (Anode) and node SW_OUT (Cathode) for reverse bias during normal closed-switch operation.

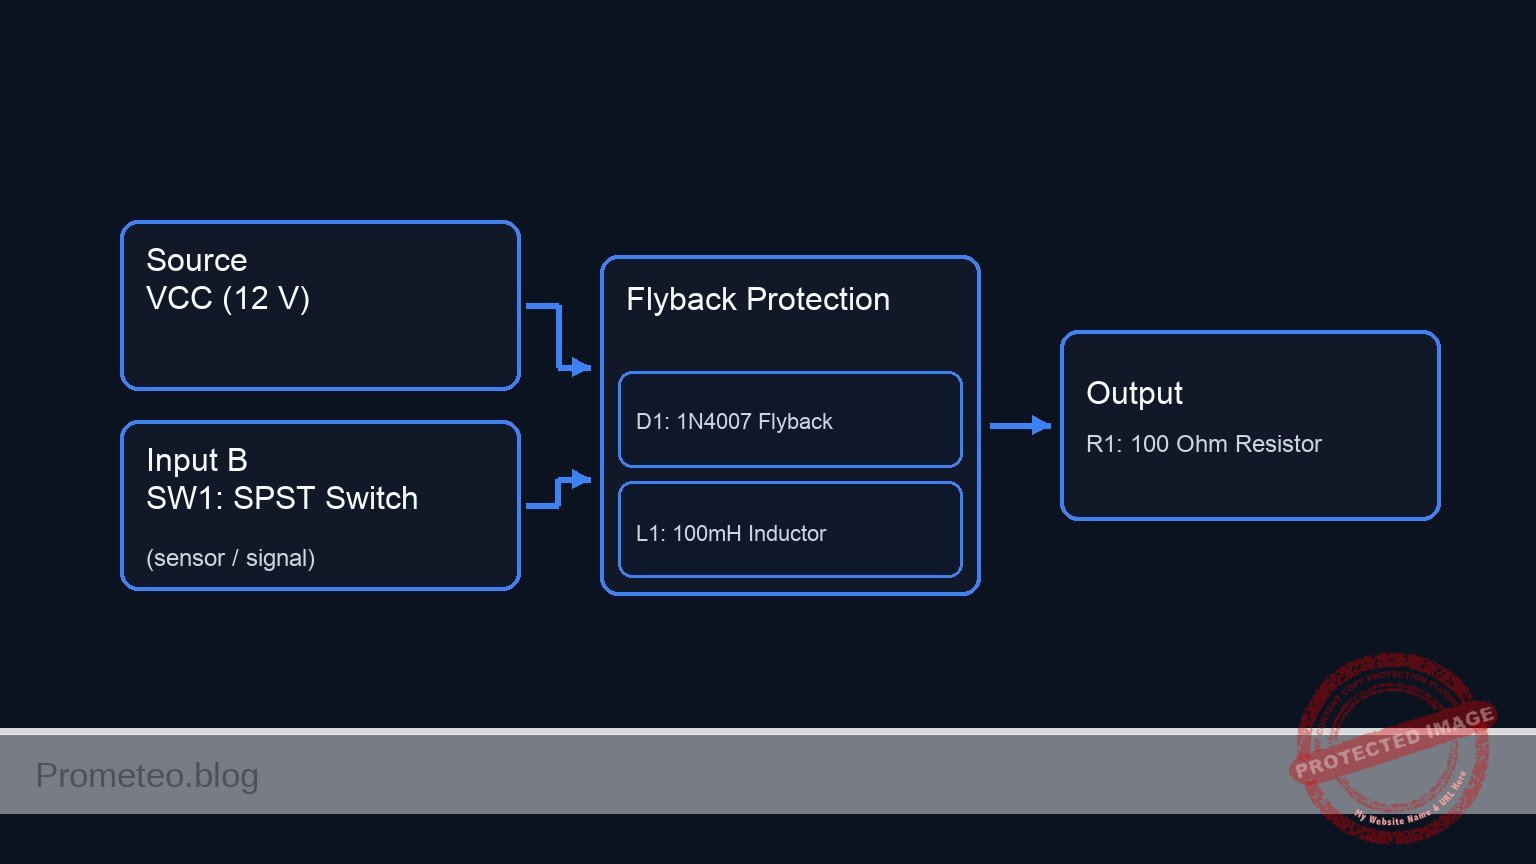
Conceptual block diagram

Conceptual block diagram — Flyback Protection
Quick read: inputs → main block → output (actuator or measurement). This summarizes the ASCII schematic below.

Schematic

VCC (12 V) --> [ SW1: SPST Switch ] --(SW_OUT)--> [ L1: 100mH Inductor ] --(L_MID)--> [ R1: 100 Ω Resistor ] --> GND
                                         ^
                                         |
                              (Cathode)  |
                           [ D1: 1N4007 Flyback ]
                              (Anode)    ^
                                         |
                                        GND
Electrical Schematic

Electrical diagram

Electrical diagram for case: Inductive peak protection
Generated from the validated SPICE netlist for this case.

🔒 This electrical diagram is premium. With the monthly membership (7-day free trial) you can unlock the complete didactic material and the print-ready PDF pack.🔓 See premium access plans

Measurements and tests

  1. Connect the oscilloscope probe to node SW_OUT and attach the ground clip to node 0. Set the oscilloscope trigger to a falling edge, single-shot mode.
  2. Begin with the flyback diode (D1) completely disconnected from the circuit.
  3. Close the switch (SW1) to allow current to flow. Wait a moment for the magnetic field in the inductor to fully build up.
  4. Quickly open the switch (SW1). Observe the oscilloscope capture; you will see a massive negative voltage transient as the inductor acts as a current source, forcing current across the open switch gap.
  5. Connect the flyback diode (D1), verifying that the cathode (striped end) connects to node SW_OUT and the anode connects to node 0.
  6. Repeat the switching process. The oscilloscope trace will now show the negative transient safely clamped at roughly -0.7 V as the diode forward-biases to provide a safe discharge path.

SPICE netlist and simulation

Reference SPICE Netlist (ngspice) — excerptFull SPICE netlist (ngspice)

* Inductive peak protection
.width out=256

V1 VCC 0 DC 12

* SW1 modeled as a voltage-controlled switch connecting VCC to SW_OUT
S1 VCC SW_OUT SW_CTRL 0 SW_MODEL
V_SW_CTRL SW_CTRL 0 PULSE(0 5 100u 1u 1u 500u 1000u)
.model SW_MODEL SW(VT=2.5 VH=0.1 RON=0.01 ROFF=100Meg)

L1 SW_OUT L_MID 100m
R1 L_MID 0 100

* ... (truncated in public view) ...

Copy this content into a .cir file and run with ngspice.

🔒 Part of this section is premium. With the monthly membership (7-day free trial) you can access the full content (materials, wiring, detailed build, validation, troubleshooting, variants and checklist) and download the complete print-ready PDF pack.

* Inductive peak protection
.width out=256

V1 VCC 0 DC 12

* SW1 modeled as a voltage-controlled switch connecting VCC to SW_OUT
S1 VCC SW_OUT SW_CTRL 0 SW_MODEL
V_SW_CTRL SW_CTRL 0 PULSE(0 5 100u 1u 1u 500u 1000u)
.model SW_MODEL SW(VT=2.5 VH=0.1 RON=0.01 ROFF=100Meg)

L1 SW_OUT L_MID 100m
R1 L_MID 0 100

* Flyback protection diode
D1 0 SW_OUT 1N4007
.model 1N4007 D(IS=1e-9 N=1.9 RS=0.03 BV=1000 IBV=5e-08 CJO=10p VJ=0.7 M=0.5 TT=1e-07)

.op
.tran 1u 2000u
.print tran V(SW_CTRL) V(SW_OUT) V(L_MID) V(VCC) I(L1)

.end

Simulation Results (Transient Analysis)

Simulation Results (Transient Analysis)
Analysis: The transient analysis spans 0 s to 2 ms and captures the switching interval. The switching node and inductor current remain bounded, consistent with the flyback path protecting the switch. Main ranges: l1#branch 120 nA -> 62.7 mA; v(sw_out) -884 mV -> 12 V; v(l_mid) 12 uV -> 6.27 V.
Show raw data table (2088 rows)
Index   time            v(sw_ctrl)      v(sw_out)       v(l_mid)        v(vcc)          l1#branch
0	0.000000e+00	0.000000e+00	1.199996e-05	1.199996e-05	1.200000e+01	1.199996e-07
1	1.000000e-08	0.000000e+00	1.199996e-05	1.199996e-05	1.200000e+01	1.199996e-07
2	2.000000e-08	0.000000e+00	1.199996e-05	1.199996e-05	1.200000e+01	1.199996e-07
3	4.000000e-08	0.000000e+00	1.199996e-05	1.199996e-05	1.200000e+01	1.199996e-07
4	8.000000e-08	0.000000e+00	1.199996e-05	1.199996e-05	1.200000e+01	1.199996e-07
5	1.600000e-07	0.000000e+00	1.199996e-05	1.199996e-05	1.200000e+01	1.199996e-07
6	3.200000e-07	0.000000e+00	1.199996e-05	1.199996e-05	1.200000e+01	1.199996e-07
7	6.400000e-07	0.000000e+00	1.199996e-05	1.199996e-05	1.200000e+01	1.199996e-07
8	1.280000e-06	0.000000e+00	1.199996e-05	1.199996e-05	1.200000e+01	1.199996e-07
9	2.280000e-06	0.000000e+00	1.199996e-05	1.199996e-05	1.200000e+01	1.199996e-07
10	3.280000e-06	0.000000e+00	1.199996e-05	1.199996e-05	1.200000e+01	1.199996e-07
11	4.280000e-06	0.000000e+00	1.199996e-05	1.199996e-05	1.200000e+01	1.199996e-07
12	5.280000e-06	0.000000e+00	1.199996e-05	1.199996e-05	1.200000e+01	1.199996e-07
13	6.280000e-06	0.000000e+00	1.199996e-05	1.199996e-05	1.200000e+01	1.199996e-07
14	7.280000e-06	0.000000e+00	1.199996e-05	1.199996e-05	1.200000e+01	1.199996e-07
15	8.280000e-06	0.000000e+00	1.199996e-05	1.199996e-05	1.200000e+01	1.199996e-07
16	9.280000e-06	0.000000e+00	1.199996e-05	1.199996e-05	1.200000e+01	1.199996e-07
17	1.028000e-05	0.000000e+00	1.199996e-05	1.199996e-05	1.200000e+01	1.199996e-07
18	1.128000e-05	0.000000e+00	1.199996e-05	1.199996e-05	1.200000e+01	1.199996e-07
19	1.228000e-05	0.000000e+00	1.199996e-05	1.199996e-05	1.200000e+01	1.199996e-07
20	1.328000e-05	0.000000e+00	1.199996e-05	1.199996e-05	1.200000e+01	1.199996e-07
21	1.428000e-05	0.000000e+00	1.199996e-05	1.199996e-05	1.200000e+01	1.199996e-07
22	1.528000e-05	0.000000e+00	1.199996e-05	1.199996e-05	1.200000e+01	1.199996e-07
23	1.628000e-05	0.000000e+00	1.199996e-05	1.199996e-05	1.200000e+01	1.199996e-07
... (2064 more rows) ...


Reference SPICE netlist (ngspice)

* Inductive peak protection
.width out=256

V1 VCC 0 DC 12

* SW1 modeled as a voltage-controlled switch connecting VCC to SW_OUT
S1 VCC SW_OUT SW_CTRL 0 SW_MODEL
V_SW_CTRL SW_CTRL 0 PULSE(0 5 100u 1u 1u 500u 1000u)
.model SW_MODEL SW(VT=2.5 VH=0.1 RON=0.01 ROFF=100Meg)

L1 SW_OUT L_MID 100m
R1 L_MID 0 100

* Flyback protection diode
D1 0 SW_OUT 1N4007
.model 1N4007 D(IS=1e-9 N=1.9 RS=0.03 BV=1000 IBV=5e-08 CJO=10p VJ=0.7 M=0.5 TT=1e-07)

.op
.tran 1u 2000u
.print tran V(SW_CTRL) V(SW_OUT) V(L_MID) V(VCC) I(L1)

.end

Simulation Results (Transient Analysis)

Simulation Results (Transient Analysis)
Analysis: The transient analysis spans 0 s to 2 ms and captures the switching interval. The switching node and inductor current remain bounded, consistent with the flyback path protecting the switch. Main ranges: l1#branch 120 nA -> 62.7 mA; v(sw_out) -884 mV -> 12 V; v(l_mid) 12 uV -> 6.27 V.

Common mistakes and how to avoid them

  • Reversing the diode polarity: Placing the diode with the anode pointing to the positive voltage node creates a direct short circuit to ground when the switch is closed. This will destroy the diode or trigger the power supply’s overcurrent protection. Always ensure the cathode faces the higher potential.
  • Using a diode with inadequate current rating: The flyback diode must safely handle a peak forward current equal to the steady-state current of the inductor just before switching. Always use properly rated rectifier, Schottky, or fast-recovery diodes.
  • Omitting the series resistor: Connecting a pure inductor directly across a high-current DC source acts as a near short-circuit once the magnetic field is fully established. Always include a current-limiting series resistor, or ensure the inductor (such as a relay coil) has sufficient internal DC resistance.

Troubleshooting

  • Symptom: The power supply shuts down or its current limit LED turns on immediately upon closing the switch.
    • Cause: The flyback diode is installed backwards, creating a short circuit from the power source to ground.
    • Fix: Disconnect power immediately and flip the diode so its striped end (cathode) faces the switch node.
  • Symptom: A massive voltage spike still appears on the oscilloscope even with the diode supposedly installed.
    • Cause: The diode may have blown open due to a previous overcurrent event, or the breadboard connection is loose.
    • Fix: Verify diode continuity using a multimeter’s diode mode, and check the physical seating of the pins at the switch and ground nodes.
  • Symptom: The oscilloscope trace shows high-frequency ringing instead of a clean clamp.
    • Cause: Parasitic capacitance in the switch, wiring, or oscilloscope probes interacting with the inductor.
    • Fix: Ensure the oscilloscope probe is properly compensated (x10 mode recommended for high voltage spikes) and keep ground leads as short as physically possible.

Possible improvements and extensions

  • Automated switching with a MOSFET: Replace the mechanical switch with an N-channel MOSFET driven by a square wave generator (configured as a low-side switch) to observe repetitive clamping on the oscilloscope in real-time.
  • Fast discharge using a Zener diode: Add an appropriately rated Zener diode in series with the standard flyback diode (anode connected to anode). This allows the inductor to discharge its energy much faster by clamping the voltage at a higher, but strictly controlled, level.

More Practical Cases on Prometeo.blog

Find this product and/or books on this topic on Amazon

Go to Amazon

As an Amazon Associate, I earn from qualifying purchases. If you buy through this link, you help keep this project running.

Quick Quiz

Question 1: What is the main purpose of the flyback diode in this inductive load circuit?


Question 2: Which component stores energy in its magnetic field while current is flowing?


Question 3: What happens to the inductor current immediately after the switch opens?


Question 4: Why can an unprotected inductive load damage a switching device?


Question 5: In the SPICE model, what does the pulsed switch-control source represent?


Question 6: During normal energized operation, what should the flyback diode ideally do?


Question 7: Which measurement is most useful to observe the switching transient in the simulation?


Question 8: What role does R1 play in this practical model?


Question 9: Why is this circuit relevant for relays, solenoids and small motors?


Question 10: What should a correct validation show for this case before publication?


Carlos Núñez Zorrilla
Electronics & Computer Engineer

Telecommunications Electronics Engineer and Computer Engineer (official degrees in Spain).

Follow me:


Practical case: RC pushbutton debounce

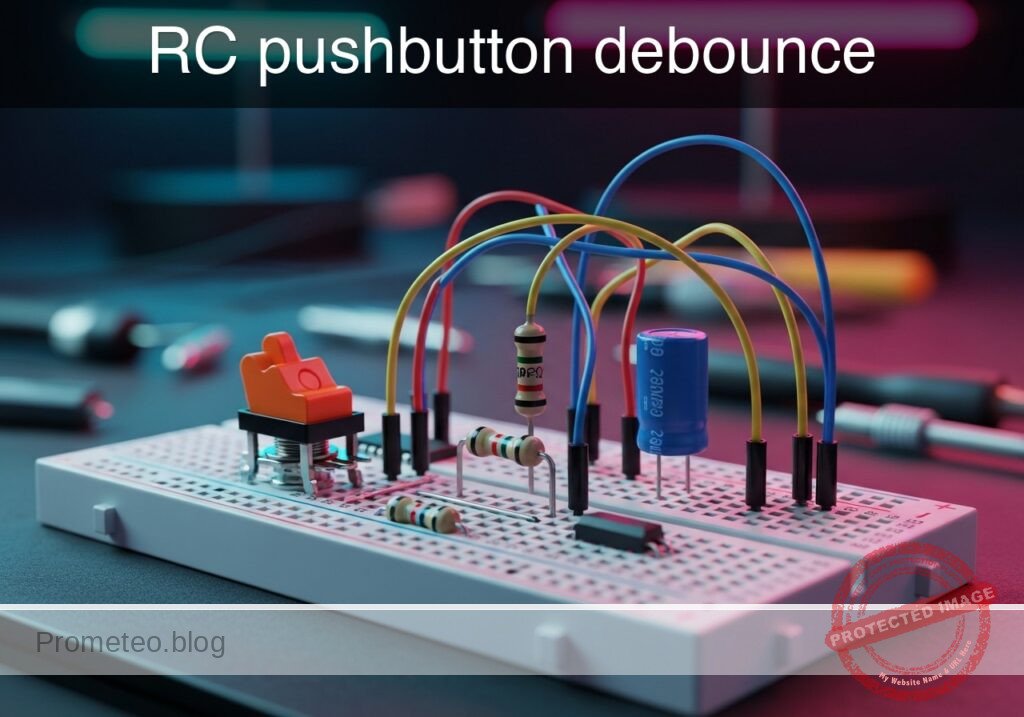
RC pushbutton debounce prototype (Maker Style)

Level: Medium | Use a capacitor to mitigate mechanical noise when actuating a physical switch.

Objective and use case

In this practical case, you will build a passive RC (Resistor-Capacitor) network connected to a mechanical switch to filter out the high-frequency voltage spikes generated by contact bounce.

Why this is useful:
* Preventing multiple false triggers in digital counters or step sequences.
* Ensuring clean, singular interrupt signals for microcontrollers.
* Stabilizing input readings for memory elements like flip-flops and latches.
* Creating reliable and predictable user-interface buttons in embedded systems.

Expected outcome:
* The mechanical bounce, normally lasting 1–5 ms, is completely absorbed by the capacitor.
* The voltage at the switch node transitions smoothly rather than oscillating between logic levels.
* The charging time constant defines a clean transient voltage curve upon button release.
* Oscilloscope measurements will confirm the elimination of the bounce time in milliseconds.

Target audience and level: Intermediate electronics students and hobbyists learning about transient signals and physical switch characteristics.

Materials

  • V1: 5 V DC power supply
  • SW1: SPST momentary pushbutton switch, function: input trigger
  • R1: 10 kΩ resistor, function: pull-up for VSW
  • C1: 1 µF capacitor, function: debounce smoothing parallel to switch

Wiring guide

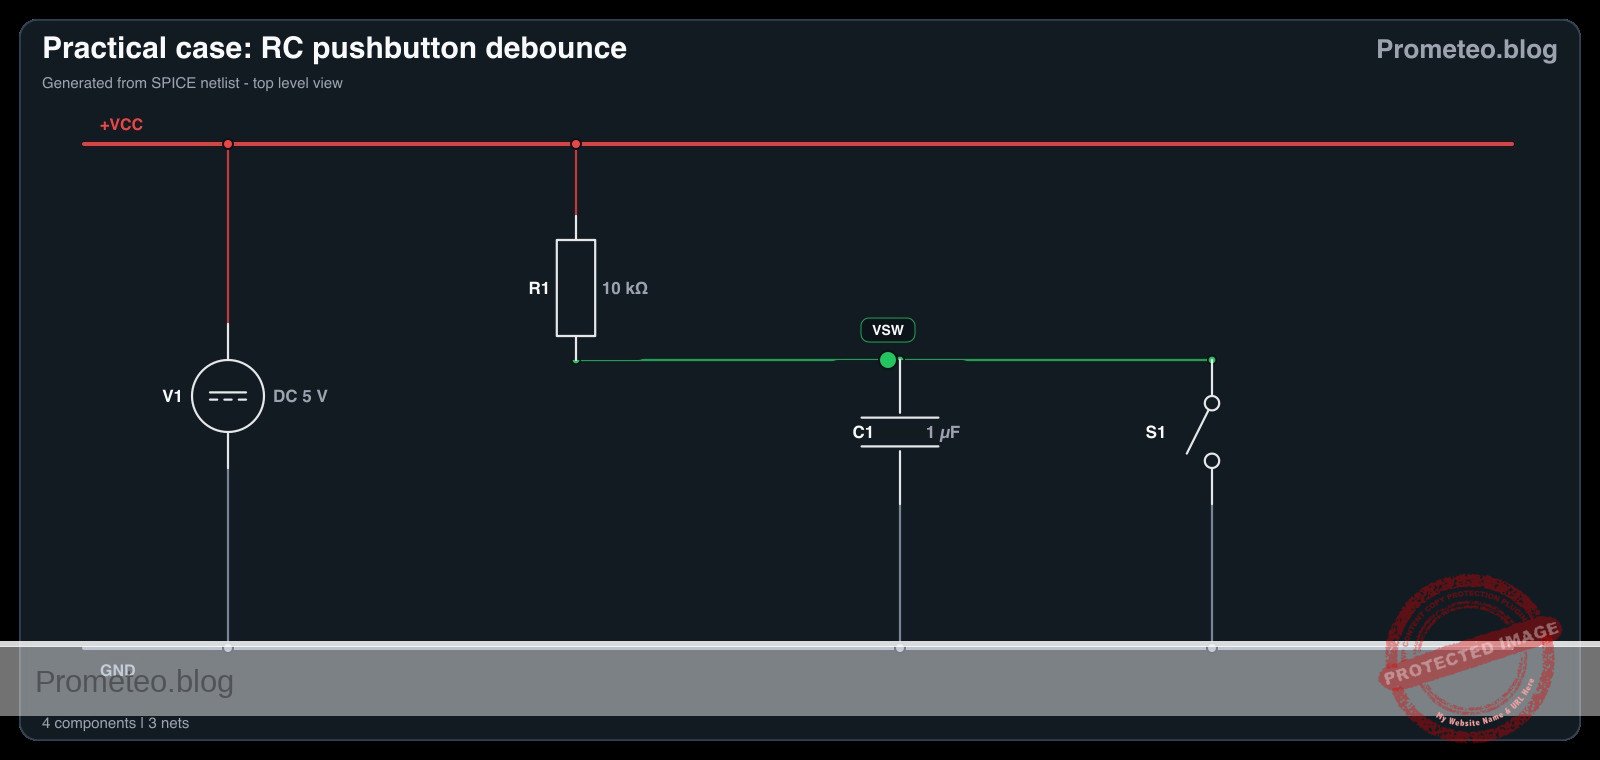
  • V1: connects between node VCC and node 0 (GND).
  • R1: connects between node VCC and node VSW.
  • SW1: connects between node VSW and node 0.
  • C1: connects between node VSW and node 0.

Conceptual block diagram

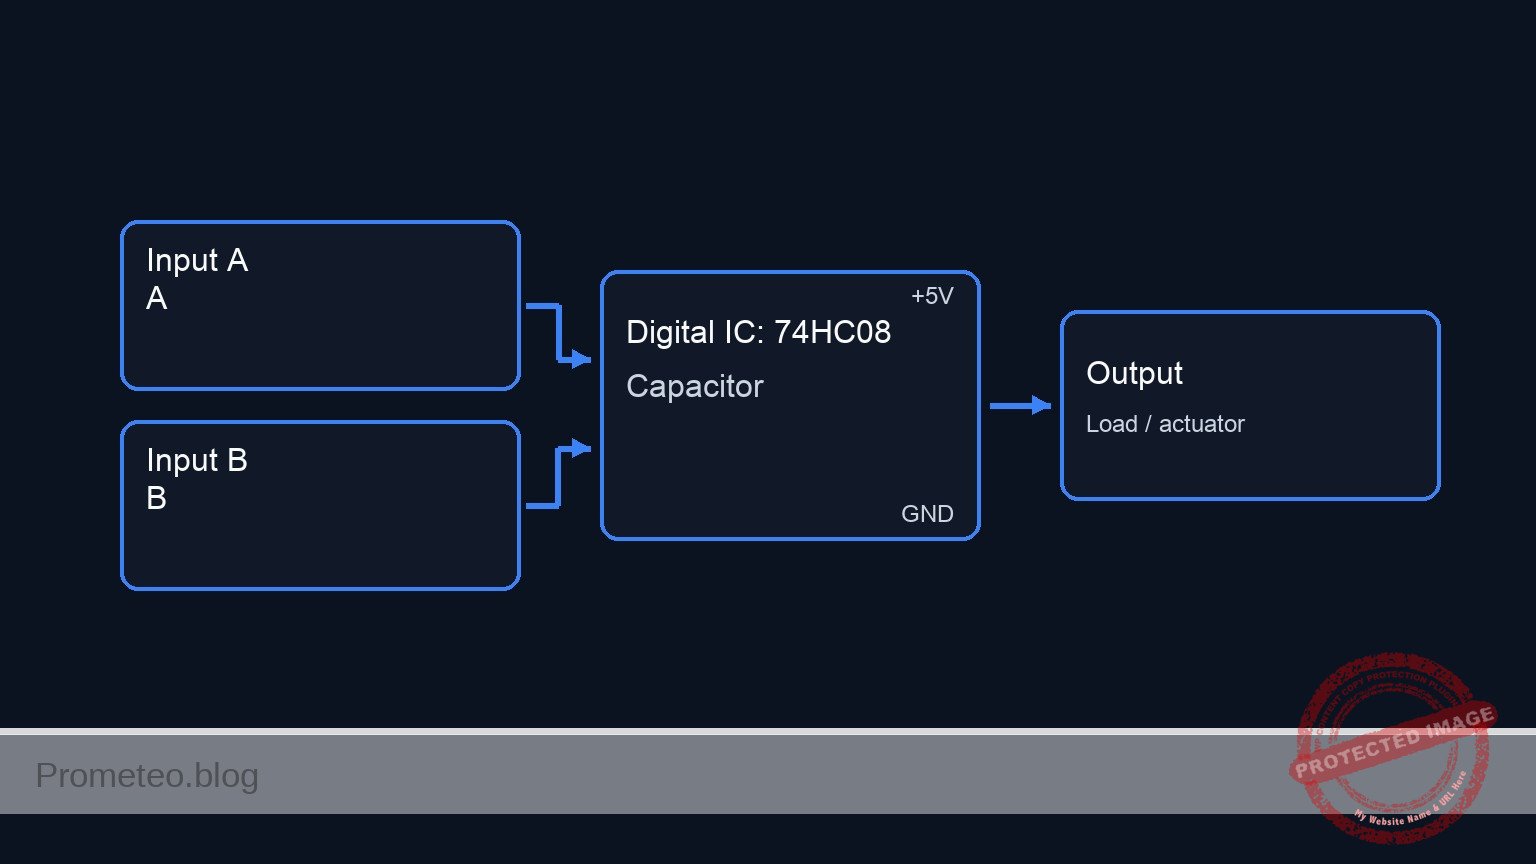
Conceptual block diagram — 74HC08 Capacitor
Quick read: inputs → main block → output (actuator or measurement). This summarizes the ASCII schematic below.

Schematic

VCC (5 V) --> [ R1: 10 kΩ Pull-up ] --+--(Node VSW)--> [ Debounced Output ]
                                    |
                                    +--> [ SW1: Pushbutton ] --> GND
                                    |
                                    +--> [ C1: 1µF Capacitor ] --> GND
Electrical Schematic

Electrical diagram

Electrical diagram for case: RC pushbutton debounce
Generated from the validated SPICE netlist for this case.

🔒 This electrical diagram is premium. With the monthly membership (7-day free trial) you can unlock the complete didactic material and the print-ready PDF pack.🔓 See premium access plans

Measurements and tests

  1. Connect an oscilloscope probe to node VSW and the ground clip to node 0.
  2. Set the oscilloscope to trigger on a falling edge at a threshold of approximately 2.5 V. Set the time base to 2 ms/div to accurately capture the Bounce-Time-ms.
  3. Actuate SW1 (press the button) and observe the Transient-Voltage on the screen. The voltage should drop to 0 V smoothly without the rapid spikes characteristic of mechanical bounce.
  4. Release the switch and observe the rising edge. Measure the time it takes for the voltage to reach 3.15 V (approx. 63.2% of 5 V). This represents one RC time constant (\tau = R × C), which should theoretically be 10 ms.
  5. Temporarily remove C1 from the circuit, press the switch again, and observe the raw mechanical bounce to compare the before-and-after transient signals. Reinsert C1 once complete.

SPICE netlist and simulation

Reference SPICE Netlist (ngspice) — excerptFull SPICE netlist (ngspice)

* Practical case: RC pushbutton debounce
.width out=256

* Main DC Power Supply
V1 VCC 0 DC 5

* Pull-up Resistor
R1 VCC VSW 10k

* Debounce Smoothing Capacitor
C1 VSW 0 1u

* Pushbutton SW1 modeled as a voltage-controlled switch
* Connects VSW to 0 (GND) when the control voltage is high
S1 VSW 0 ctrl 0 switch_model
.model switch_model SW(Vt=2.5 Ron=1 Roff=100Meg)

* Control pulse simulating the user pressing the button
* Presses the button at 5ms, holds for 20ms, repeats every 50ms
Vctrl ctrl 0 PULSE(0 5 5m 1u 1u 20m 50m)
* ... (truncated in public view) ...

Copy this content into a .cir file and run with ngspice.

🔒 Part of this section is premium. With the monthly membership (7-day free trial) you can access the full content (materials, wiring, detailed build, validation, troubleshooting, variants and checklist) and download the complete print-ready PDF pack.

* Practical case: RC pushbutton debounce
.width out=256

* Main DC Power Supply
V1 VCC 0 DC 5

* Pull-up Resistor
R1 VCC VSW 10k

* Debounce Smoothing Capacitor
C1 VSW 0 1u

* Pushbutton SW1 modeled as a voltage-controlled switch
* Connects VSW to 0 (GND) when the control voltage is high
S1 VSW 0 ctrl 0 switch_model
.model switch_model SW(Vt=2.5 Ron=1 Roff=100Meg)

* Control pulse simulating the user pressing the button
* Presses the button at 5ms, holds for 20ms, repeats every 50ms
Vctrl ctrl 0 PULSE(0 5 5m 1u 1u 20m 50m)

* Analysis directives
.op
.tran 100u 100m

* CRITICAL: Print input (button press) and output (debounced signal)
.print tran V(ctrl) V(VSW)

.end

Simulation Results (Transient Analysis)

Simulation Results (Transient Analysis)
Show raw data table (1134 rows)
Index   time            v(ctrl)         v(vsw)
0	0.000000e+00	0.000000e+00	4.999500e+00
1	1.000000e-06	0.000000e+00	4.999500e+00
2	2.000000e-06	0.000000e+00	4.999500e+00
3	4.000000e-06	0.000000e+00	4.999500e+00
4	8.000000e-06	0.000000e+00	4.999500e+00
5	1.600000e-05	0.000000e+00	4.999500e+00
6	3.200000e-05	0.000000e+00	4.999500e+00
7	6.400000e-05	0.000000e+00	4.999500e+00
8	1.280000e-04	0.000000e+00	4.999500e+00
9	2.280000e-04	0.000000e+00	4.999500e+00
10	3.280000e-04	0.000000e+00	4.999500e+00
11	4.280000e-04	0.000000e+00	4.999500e+00
12	5.280000e-04	0.000000e+00	4.999500e+00
13	6.280000e-04	0.000000e+00	4.999500e+00
14	7.280000e-04	0.000000e+00	4.999500e+00
15	8.280000e-04	0.000000e+00	4.999500e+00
16	9.280000e-04	0.000000e+00	4.999500e+00
17	1.028000e-03	0.000000e+00	4.999500e+00
18	1.128000e-03	0.000000e+00	4.999500e+00
19	1.228000e-03	0.000000e+00	4.999500e+00
20	1.328000e-03	0.000000e+00	4.999500e+00
21	1.428000e-03	0.000000e+00	4.999500e+00
22	1.528000e-03	0.000000e+00	4.999500e+00
23	1.628000e-03	0.000000e+00	4.999500e+00
... (1110 more rows) ...


Reference SPICE netlist (ngspice)

* Practical case: RC pushbutton debounce
.width out=256

* Main DC Power Supply
V1 VCC 0 DC 5

* Pull-up Resistor
R1 VCC VSW 10k

* Debounce Smoothing Capacitor
C1 VSW 0 1u

* Pushbutton SW1 modeled as a voltage-controlled switch
* Connects VSW to 0 (GND) when the control voltage is high
S1 VSW 0 ctrl 0 switch_model
.model switch_model SW(Vt=2.5 Ron=1 Roff=100Meg)

* Control pulse simulating the user pressing the button
* Presses the button at 5ms, holds for 20ms, repeats every 50ms
Vctrl ctrl 0 PULSE(0 5 5m 1u 1u 20m 50m)

* Analysis directives
.op
.tran 100u 100m

* CRITICAL: Print input (button press) and output (debounced signal)
.print tran V(ctrl) V(VSW)

.end

Simulation Results (Transient Analysis)

Simulation Results (Transient Analysis)

Common mistakes and how to avoid them

  • Choosing a capacitor value that is too large: Using a 100 µF capacitor with a 10 kΩ pull-up results in a 1-second time constant, causing a sluggish button response. Solution: Keep C1 between 100 nF and 1 µF for standard 10 kΩ pull-up resistors.
  • Missing the pull-up resistor: Without R1, node VSW will float unpredictably when the switch is open. Solution: Always ensure R1 is securely connected between VCC and the switch node.
  • Feeding the slow RC signal directly into standard digital logic: Standard logic gates (like a basic 74HC08) can oscillate if fed a slowly rising voltage. Solution: Use this circuit to understand the RC transient, but for real digital inputs, feed the debounced signal through a Schmitt Trigger IC to square up the edges.

Troubleshooting

  • Symptom: The voltage at node VSW remains constantly at 0 V.
  • Cause: The switch is physically stuck closed, or the capacitor C1 is shorted.
  • Fix: Check the switch continuity with a multimeter and replace C1 if defective.
  • Symptom: The voltage at node VSW stays constantly at 5 V even when pressed.
  • Cause: SW1 is not properly connected to node 0 (Ground).
  • Fix: Verify the ground connection on the lower terminal of the switch.
  • Symptom: Switch bounce is still visible on the rising edge.
  • Cause: The RC time constant is too short compared to the mechanical bounce duration of that specific switch.
  • Fix: Increase the value of C1 (e.g., from 0.1 µF to 1 µF).
  • Symptom: The switch contacts fail or degrade after repeated presses.
  • Cause: The capacitor dumps its charge instantly through the switch contacts, causing high inrush current.
  • Fix: For long-term reliability, add a small 100 Ω resistor in series with the switch to limit the discharge current.

Possible improvements and extensions

  • Add a Schmitt Trigger buffer: Route the VSW node through a Schmitt Trigger inverter (such as the 74HC14) to convert the exponential RC charging curve into a crisp, bounce-free digital logic pulse.
  • Hardware vs Software Debounce comparison: Keep this hardware RC circuit on one button, and wire a raw button to a microcontroller. Implement a software debounce algorithm on the raw button and compare the resource usage and reliability of both methods.

More Practical Cases on Prometeo.blog

Find this product and/or books on this topic on Amazon

Go to Amazon

As an Amazon Associate, I earn from qualifying purchases. If you buy through this link, you help keep this project running.

Quick Quiz

Question 1: What is the primary purpose of the RC network described in the article?


Question 2: How long does mechanical bounce typically last according to the context?


Question 3: Which of the following is a direct benefit of using this RC network?


Question 4: What happens to the voltage at the switch node when the RC network is applied?


Question 5: What defines the clean transient voltage curve upon button release?


Question 6: What instrument is mentioned to confirm the elimination of the bounce time?


Question 7: What type of components make up the passive network used for debouncing in this case?


Question 8: Why is debouncing important for microcontrollers?


Question 9: What effect does the capacitor have on the mechanical bounce?


Question 10: For which type of memory elements does this circuit stabilize input readings?


Carlos Núñez Zorrilla
Electronics & Computer Engineer

Telecommunications Electronics Engineer and Computer Engineer (official degrees in Spain).
Follow me:


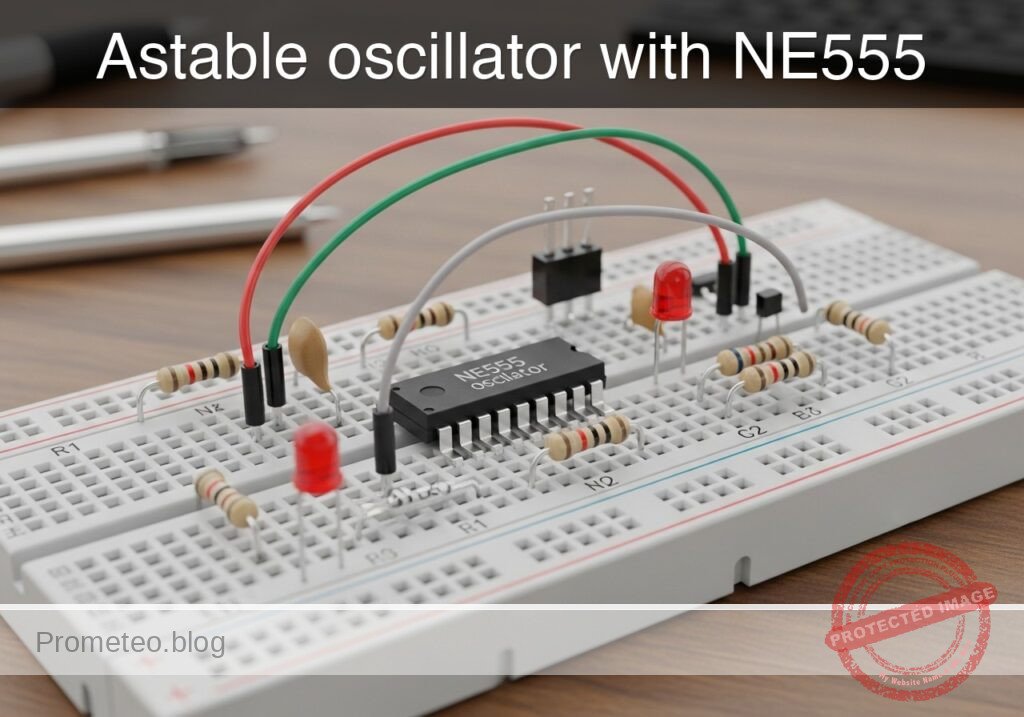
Practical case: Astable oscillator with NE555

Astable oscillator with NE555 prototype (Maker Style)

Level: Medium – Configure a capacitor in an NE555 circuit to control the oscillation frequency.

Objective and use case

In this practical case, you will build an astable multivibrator circuit using the classic NE555 timer. The core focus is to understand how the charging and discharging of a timing capacitor regulates the frequency and duty cycle of the output signal.

Why it is useful:
* Clock generation: Generates steady clock pulses for sequential digital circuits.
* Warning flashers: Drives LEDs or lamps in hazard and warning systems.
* Audio tone generation: Produces audible frequencies for buzzers, alarms, and electronic metronomes.
* PWM foundations: Demonstrates the underlying principles needed to generate Pulse Width Modulation signals.

Expected outcome:
* The circuit will generate a continuous square wave without requiring any external trigger.
* The voltage across the timing capacitor will continuously charge and discharge between 1/3 and 2/3 of the supply voltage.
* An LED connected to the output will flash continuously at a predictable frequency of approximately 1.4 Hz.
* The frequency and duty cycle will closely match the calculated values based on the chosen RC network.

Target audience: Intermediate electronics students learning mixed-signal timing circuits and capacitor behavior.

Materials

  • U1: NE555 timer IC, function: oscillator core
  • R1: 10 kΩ resistor, function: timing resistor for charge cycle
  • R2: 47 kΩ resistor, function: timing resistor for charge and discharge cycles
  • C1: 10 µF electrolytic capacitor, function: primary timing capacitor determining frequency
  • C2: 10 nF ceramic capacitor, function: control voltage noise decoupling
  • R3: 330 Ω resistor, function: LED current limiting
  • D1: red LED, function: visual frequency indicator
  • V1: 5 V DC supply, function: circuit power

Wiring guide

  • V1: Connects between node VCC (positive) and node 0 (GND).
  • U1:
  • Pin 8 (VCC) connects to node VCC.
  • Pin 1 (GND) connects to node 0.
  • Pin 4 (RESET) connects to node VCC.
  • Pin 2 (TRIG) and Pin 6 (THRES) are tied together to form node TH_TR.
  • Pin 7 (DISCH) connects to node DISCH.
  • Pin 5 (CTRL) connects to node CV.
  • Pin 3 (OUT) connects to node VOUT.
  • R1: Connects between node VCC and node DISCH.
  • R2: Connects between node DISCH and node TH_TR.
  • C1: Connects between node TH_TR (positive lead) and node 0 (negative lead).
  • C2: Connects between node CV and node 0.
  • R3: Connects between node VOUT and node LED_A.
  • D1: Connects between node LED_A (anode) and node 0 (cathode).

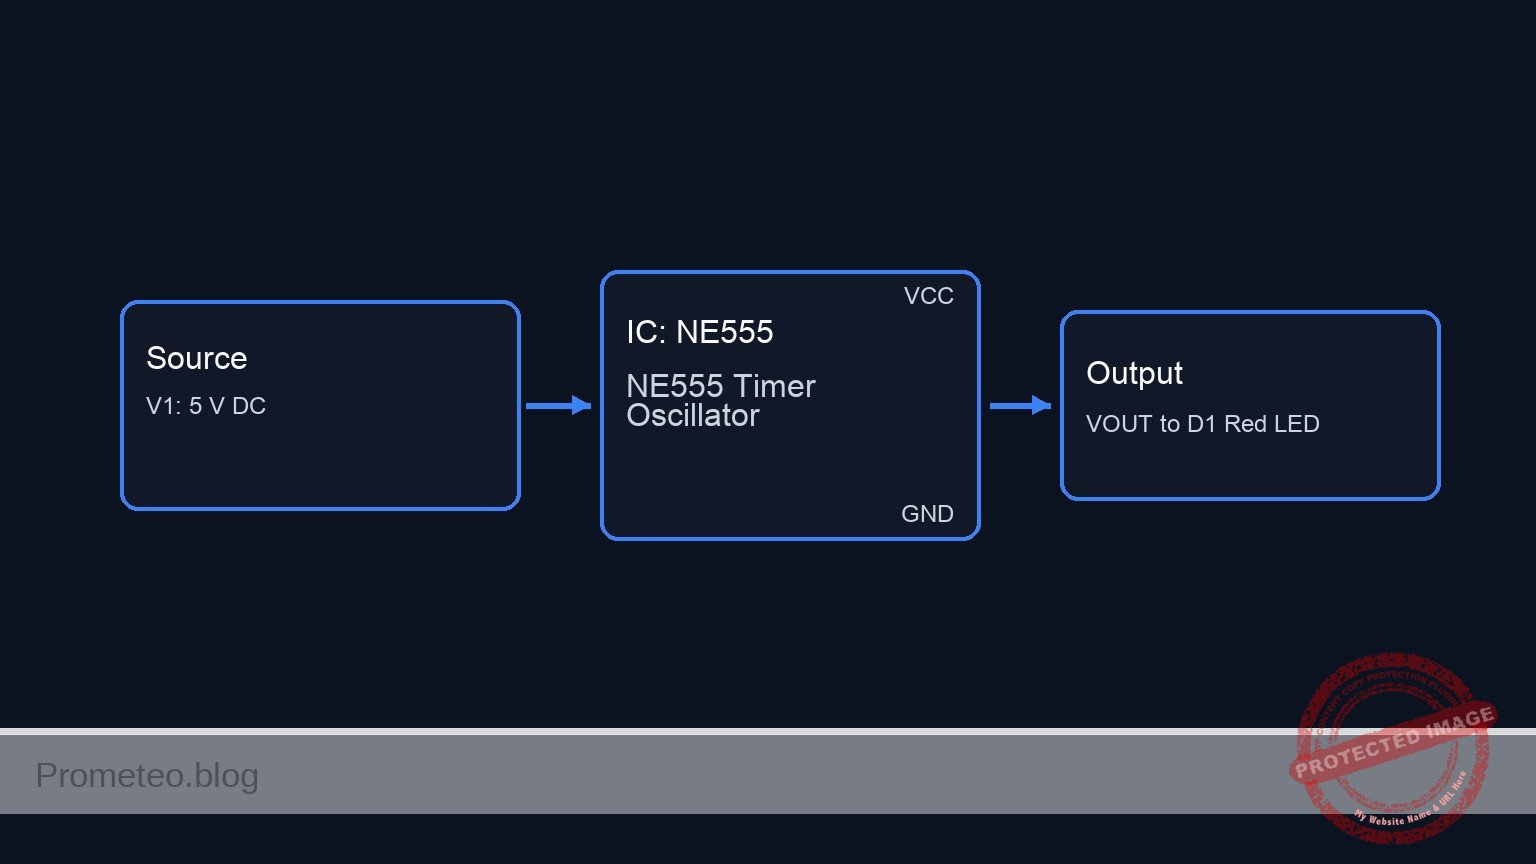
Conceptual block diagram

Conceptual block diagram — NE555 NE555 Timer Oscillator
Quick read: inputs → main block → output (actuator or measurement). This summarizes the ASCII schematic below.

Schematic

[ V1: 5 V DC ] --(PWR/RST: Pins 8,4) ------------------> [                 ]
                                                        [                 ] --(VOUT: Pin 3)--> [ R3: 330 Ω ] --(LED_A)--> [ D1: Red LED ] --> GND
[ V1: 5 V DC ] --> [ R1: 10 kΩ ] --(DISCH: Pin 7) ------> [ U1: NE555 Timer ]
                       |                                [ Oscillator Core ] --(CV: Pin 5)----> [ C2: 10nF ] --> GND
                       +--> [ R2: 47 kΩ ] --(TH_TR: 2,6)>[                 ]
                                  |                     [   (Pin 1: GND)  ]
                                  +--> [ C1: 10µF ] --> GND       |
                                                                 GND
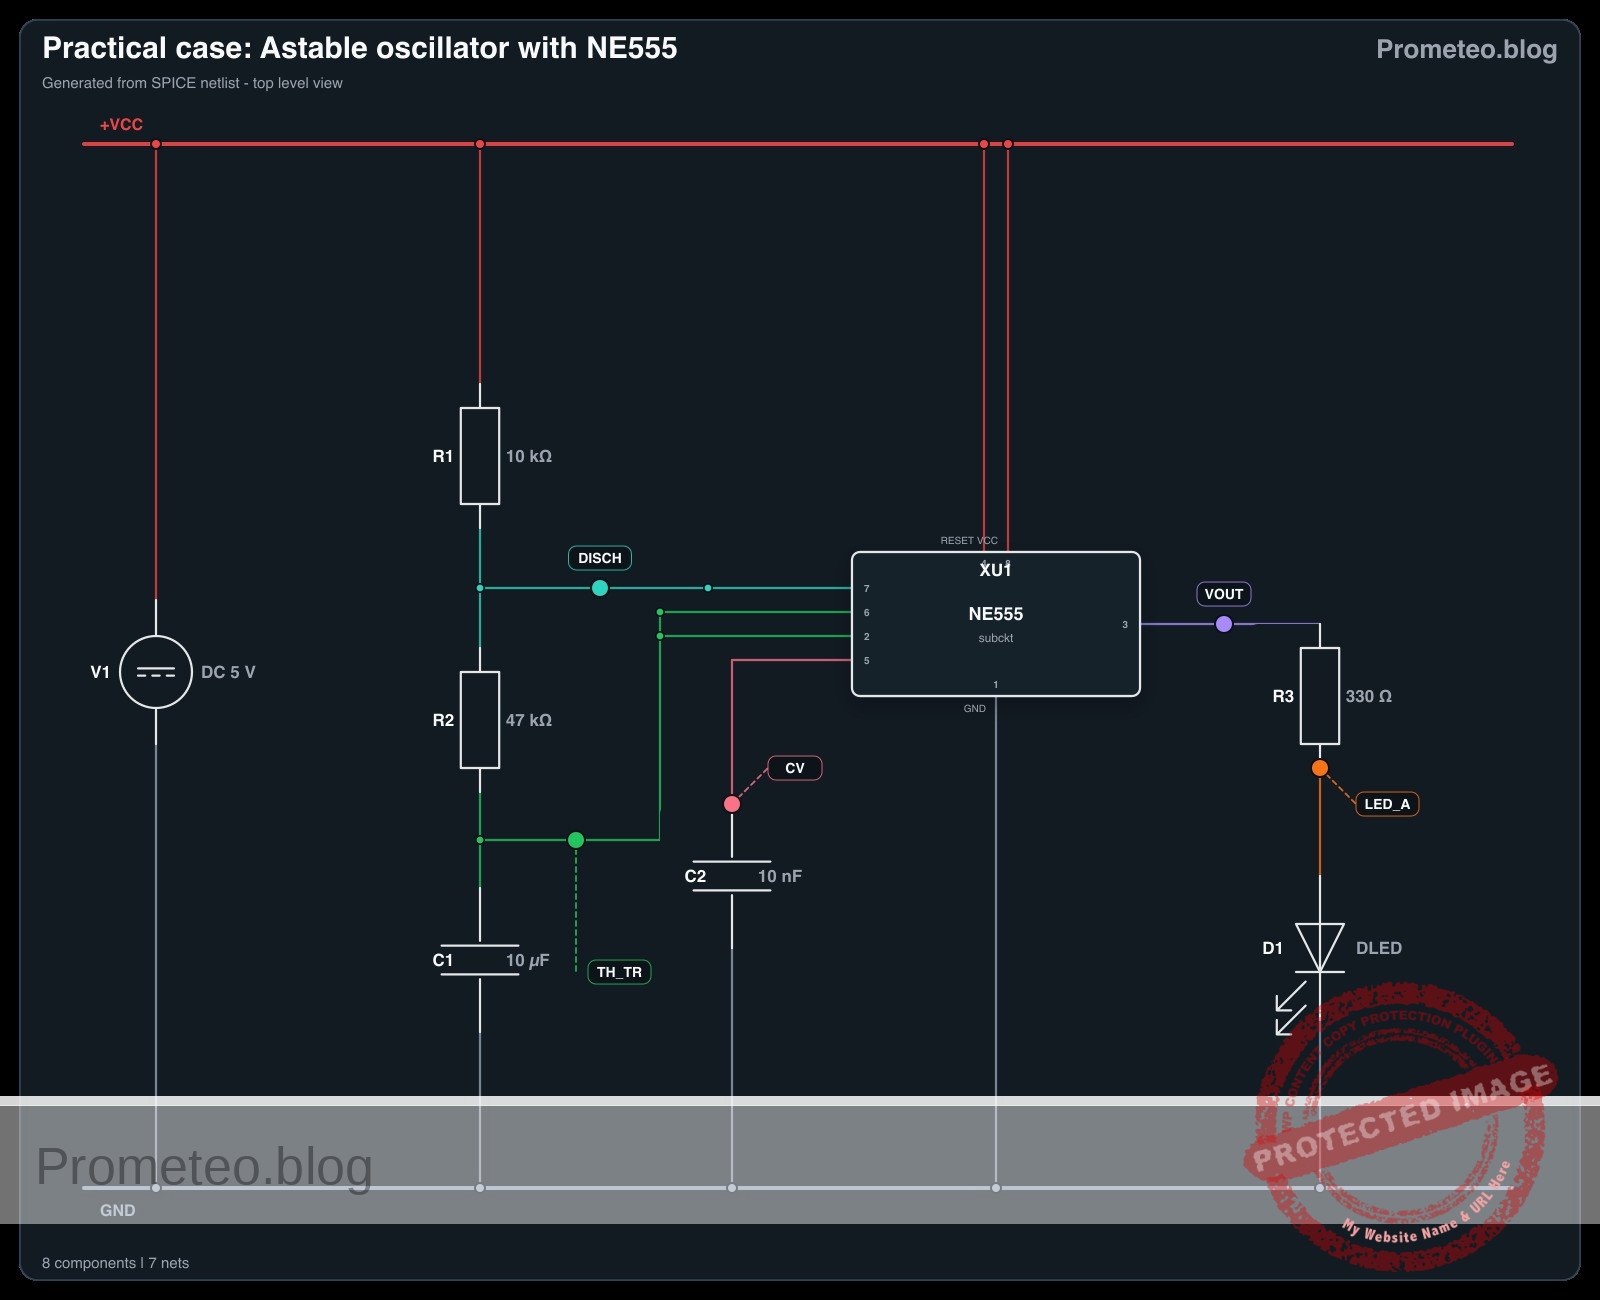
Electrical Schematic

Electrical diagram

Electrical diagram for case: Astable oscillator with NE555
Generated from the validated SPICE netlist for this case.

🔒 This electrical diagram is premium. With the monthly membership (7-day free trial) you can unlock the complete didactic material and the print-ready PDF pack.🔓 See premium access plans

Measurements and tests

  1. V-capacitor-waveform validation: Connect an oscilloscope probe to node TH_TR and the ground lead to node 0. You should observe a continuous, triangular-like waveform that charges up to roughly 3.33 V (2/3 VCC) and discharges down to roughly 1.66 V (1/3 VCC).
  2. Frequency-Hz measurement: Connect the oscilloscope or a multimeter with frequency measurement capabilities to node VOUT. You should read a frequency of approximately 1.38 Hz, generating a clear, visible flashing on the LED.
  3. Duty cycle verification: Measure the high time versus the low time on node VOUT. Because the capacitor charges through both R1 and R2 but discharges only through R2, the high time will be slightly longer than the low time (duty cycle > 50%).
  4. Supply voltage independence test: Temporarily increase V1 from 5 V to 9 V. Observe the frequency at VOUT. The frequency should remain virtually unchanged because the internal comparator thresholds scale proportionally with the supply voltage.

SPICE netlist and simulation

Reference SPICE Netlist (ngspice) — excerptFull SPICE netlist (ngspice)

* Practical case: Astable oscillator with NE555
.width out=256

* Power Supply
V1 VCC 0 DC 5

* NE555 Timer IC Subcircuit Instance
* Pins: GND TRIG OUT RESET CTRL THRES DISCH VCC_PIN
XU1 0 TH_TR VOUT VCC CV TH_TR DISCH VCC NE555

* Timing Components
R1 VCC DISCH 10k
R2 DISCH TH_TR 47k
C1 TH_TR 0 10u
C2 CV 0 10n

* Output Load (LED)
R3 VOUT LED_A 330
D1 LED_A 0 DLED

* ... (truncated in public view) ...

Copy this content into a .cir file and run with ngspice.

🔒 Part of this section is premium. With the monthly membership (7-day free trial) you can access the full content (materials, wiring, detailed build, validation, troubleshooting, variants and checklist) and download the complete print-ready PDF pack.

* Practical case: Astable oscillator with NE555
.width out=256

* Power Supply
V1 VCC 0 DC 5

* NE555 Timer IC Subcircuit Instance
* Pins: GND TRIG OUT RESET CTRL THRES DISCH VCC_PIN
XU1 0 TH_TR VOUT VCC CV TH_TR DISCH VCC NE555

* Timing Components
R1 VCC DISCH 10k
R2 DISCH TH_TR 47k
C1 TH_TR 0 10u
C2 CV 0 10n

* Output Load (LED)
R3 VOUT LED_A 330
D1 LED_A 0 DLED

* Models
.MODEL DLED D(IS=1e-19 N=1.6 RS=10 BV=5 IBV=10u)

* Behavioral NE555 Subcircuit
.SUBCKT NE555 GND TRIG OUT RESET CTRL THRES DISCH VCC_PIN
* Internal voltage divider (3 x 5k resistors)
R1 VCC_PIN CTRL 5k
R2 CTRL N1 5k
R3 N1 GND 5k

* Smooth comparators for threshold, trigger, and reset
B_COMP_TH COMP_TH GND V=0.5*(1+tanh(100*(V(THRES,GND)-V(CTRL,GND))))
B_COMP_TR COMP_TR GND V=0.5*(1+tanh(100*(V(N1,GND)-V(TRIG,GND))))
B_COMP_RST COMP_RST GND V=0.5*(1+tanh(100*(0.7-V(RESET,GND))))

* SR Latch (Integrator with positive feedback for infinite hold time)
B_LATCH GND LATCH I=V(COMP_TR,GND) - V(COMP_TH,GND) - 5*V(COMP_RST,GND) + (V(LATCH,GND)>0.5 ? 0.1 : -0.1)
C_LATCH LATCH GND 1n
R_LATCH LATCH GND 100Meg

* Latch Voltage Clamps (Clamps V(LATCH) between ~0V and ~1V)
D1 GND LATCH D_CLAMP
V_CLAMP V_CLAMP_NODE GND 1
D2 LATCH V_CLAMP_NODE D_CLAMP
.model D_CLAMP D(N=0.01 RS=1)

* Output Driver Stage
B_OUT OUT_INT GND V=V(LATCH,GND)>0.5 ? V(VCC_PIN,GND) : 0.1
R_OUT OUT_INT OUT 10

* Open-Collector Discharge Transistor (Modeled as a Switch)
B_DISCH_CTRL DISCH_CTRL GND V=V(LATCH,GND)<0.5 ? 1 : 0
S_DISCH DISCH GND DISCH_CTRL GND SW_DISCH
.model SW_DISCH SW(VT=0.5 RON=15 ROFF=100Meg)
.ENDS

* Force initial condition on timing capacitor to ensure guaranteed oscillator startup
.ic V(TH_TR)=0

* Simulation Commands
.op
.tran 1m 3
.print tran V(VOUT) V(TH_TR) V(DISCH) V(LED_A) V(CV)

Simulation Results (Transient Analysis)

Simulation Results (Transient Analysis)
Analysis: The transient analysis spans 0 s to 3 s. Main ranges: v(vout) 100 mV -> 4.9 V; v(disch) 8.02 mV -> 4.71 V; v(th_tr) 0 uV -> 3.32 V.
Show raw data table (3013 rows)
Index   time            v(vout)         v(th_tr)        v(disch)        v(led_a)        v(cv)
0	0.000000e+00	4.903386e+00	0.000000e+00	4.122467e+00	1.715117e+00	3.333333e+00
1	1.000000e-05	4.903386e+00	8.771053e-05	4.122482e+00	1.715117e+00	3.333333e+00
2	2.000000e-05	4.903386e+00	1.754195e-04	4.122498e+00	1.715117e+00	3.333333e+00
3	4.000000e-05	4.903386e+00	3.508344e-04	4.122529e+00	1.715117e+00	3.333333e+00
4	8.000000e-05	4.903386e+00	7.016457e-04	4.122590e+00	1.715117e+00	3.333333e+00
5	1.600000e-04	4.903386e+00	1.403195e-03	4.122713e+00	1.715117e+00	3.333333e+00
6	3.200000e-04	4.903386e+00	2.805997e-03	4.122959e+00	1.715117e+00	3.333333e+00
7	6.400000e-04	4.903386e+00	5.610420e-03	4.123451e+00	1.715117e+00	3.333333e+00
8	1.280000e-03	4.903386e+00	1.121455e-02	4.124434e+00	1.715117e+00	3.333333e+00
9	2.280000e-03	4.903386e+00	1.995841e-02	4.125968e+00	1.715117e+00	3.333333e+00
10	3.280000e-03	4.903386e+00	2.868694e-02	4.127499e+00	1.715117e+00	3.333333e+00
11	4.280000e-03	4.903386e+00	3.740018e-02	4.129028e+00	1.715117e+00	3.333333e+00
12	5.280000e-03	4.903386e+00	4.609814e-02	4.130554e+00	1.715117e+00	3.333333e+00
13	6.280000e-03	4.903386e+00	5.478085e-02	4.132077e+00	1.715117e+00	3.333333e+00
14	7.280000e-03	4.903386e+00	6.344835e-02	4.133597e+00	1.715117e+00	3.333333e+00
15	8.280000e-03	4.903386e+00	7.210065e-02	4.135115e+00	1.715117e+00	3.333333e+00
16	9.280000e-03	4.903386e+00	8.073778e-02	4.136630e+00	1.715117e+00	3.333333e+00
17	1.028000e-02	4.903386e+00	8.935978e-02	4.138143e+00	1.715117e+00	3.333333e+00
18	1.128000e-02	4.903386e+00	9.796666e-02	4.139653e+00	1.715117e+00	3.333333e+00
19	1.228000e-02	4.903386e+00	1.065585e-01	4.141160e+00	1.715117e+00	3.333333e+00
20	1.328000e-02	4.903386e+00	1.151352e-01	4.142665e+00	1.715117e+00	3.333333e+00
21	1.428000e-02	4.903386e+00	1.236969e-01	4.144166e+00	1.715117e+00	3.333333e+00
22	1.528000e-02	4.903386e+00	1.322436e-01	4.145666e+00	1.715117e+00	3.333333e+00
23	1.628000e-02	4.903386e+00	1.407753e-01	4.147162e+00	1.715117e+00	3.333333e+00
... (2989 more rows) ...


Reference SPICE netlist (ngspice)

* Practical case: Astable oscillator with NE555
.width out=256

* Power Supply
V1 VCC 0 DC 5

* NE555 Timer IC Subcircuit Instance
* Pins: GND TRIG OUT RESET CTRL THRES DISCH VCC_PIN
XU1 0 TH_TR VOUT VCC CV TH_TR DISCH VCC NE555

* Timing Components
R1 VCC DISCH 10k
R2 DISCH TH_TR 47k
C1 TH_TR 0 10u
C2 CV 0 10n

* Output Load (LED)
R3 VOUT LED_A 330
D1 LED_A 0 DLED

* Models
.MODEL DLED D(IS=1e-19 N=1.6 RS=10 BV=5 IBV=10u)

* Behavioral NE555 Subcircuit
.SUBCKT NE555 GND TRIG OUT RESET CTRL THRES DISCH VCC_PIN
* Internal voltage divider (3 x 5k resistors)
R1 VCC_PIN CTRL 5k
R2 CTRL N1 5k
R3 N1 GND 5k

* Smooth comparators for threshold, trigger, and reset
B_COMP_TH COMP_TH GND V=0.5*(1+tanh(100*(V(THRES,GND)-V(CTRL,GND))))
B_COMP_TR COMP_TR GND V=0.5*(1+tanh(100*(V(N1,GND)-V(TRIG,GND))))
B_COMP_RST COMP_RST GND V=0.5*(1+tanh(100*(0.7-V(RESET,GND))))

* SR Latch (Integrator with positive feedback for infinite hold time)
B_LATCH GND LATCH I=V(COMP_TR,GND) - V(COMP_TH,GND) - 5*V(COMP_RST,GND) + (V(LATCH,GND)>0.5 ? 0.1 : -0.1)
C_LATCH LATCH GND 1n
R_LATCH LATCH GND 100Meg

* Latch Voltage Clamps (Clamps V(LATCH) between ~0V and ~1V)
D1 GND LATCH D_CLAMP
V_CLAMP V_CLAMP_NODE GND 1
D2 LATCH V_CLAMP_NODE D_CLAMP
.model D_CLAMP D(N=0.01 RS=1)

* Output Driver Stage
B_OUT OUT_INT GND V=V(LATCH,GND)>0.5 ? V(VCC_PIN,GND) : 0.1
R_OUT OUT_INT OUT 10

* Open-Collector Discharge Transistor (Modeled as a Switch)
B_DISCH_CTRL DISCH_CTRL GND V=V(LATCH,GND)<0.5 ? 1 : 0
S_DISCH DISCH GND DISCH_CTRL GND SW_DISCH
.model SW_DISCH SW(VT=0.5 RON=15 ROFF=100Meg)
.ENDS

* Force initial condition on timing capacitor to ensure guaranteed oscillator startup
.ic V(TH_TR)=0

* Simulation Commands
.op
.tran 1m 3
.print tran V(VOUT) V(TH_TR) V(DISCH) V(LED_A) V(CV)

Simulation Results (Transient Analysis)

Simulation Results (Transient Analysis)
Analysis: The transient analysis spans 0 s to 3 s. Main ranges: v(vout) 100 mV -> 4.9 V; v(disch) 8.02 mV -> 4.71 V; v(th_tr) 0 uV -> 3.32 V.

Common mistakes and how to avoid them

  1. Electrolytic capacitor connected backwards: C1 is an electrolytic capacitor, meaning it is polarized. If installed backwards, it will leak current, preventing it from reaching the 2/3 VCC threshold, and the circuit will freeze. Always ensure the negative stripe is connected to ground (node 0).
  2. Using too small a value for R1: If R1 is too small (e.g., less than 1 kΩ), excessive current will flow into Pin 7 during the discharge cycle. This can overheat and permanently damage the internal discharge transistor of the NE555. Always keep R1 at a safe value (1 kΩ or higher).
  3. Leaving the RESET pin floating: Pin 4 is an active-low reset. If left unconnected, ambient electrical noise can randomly reset the timer, causing erratic oscillation or stopping the circuit entirely. Always tie Pin 4 to VCC when the reset function is not needed.

Troubleshooting

  • Symptom: The LED stays solidly ON or OFF and never blinks.
    • Cause: The timing capacitor C1 is shorted, or the wiring to Pins 2 and 6 is incomplete, preventing the trigger/threshold voltage from changing.
    • Fix: Verify that C1 is firmly seated and strictly connected between TH_TR and 0. Ensure Pins 2 and 6 are bridged.
  • Symptom: The LED appears to be continuously ON but slightly dimmer than usual.
    • Cause: The oscillation frequency is too high for the human eye to perceive the blinking (typically > 50 Hz). This happens if the RC values are too small.
    • Fix: Check the value of C1. If you accidentally used a 10 nF capacitor instead of a 10 µF capacitor, the frequency will be in the kilohertz range. Swap it for the correct 10 µF value.
  • Symptom: The oscillation frequency is highly unstable or erratic.
    • Cause: Electrical noise is interfering with the internal voltage divider of the NE555.
    • Fix: Ensure C2 (10 nF) is properly connected to Pin 5 (CTRL) and ground. Also, verify that your power supply V1 is stable.

Possible improvements and extensions

  1. Variable frequency control: Replace R2 with a 100 kΩ potentiometer in series with a 1 kΩ fixed resistor. This allows you to manually adjust the discharge rate and, consequently, dial in the oscillation frequency on the fly.
  2. Audio oscillator conversion: Swap C1 for a 100 nF ceramic capacitor and replace the LED/R3 network with a small 8 Ω speaker in series with a 100 µF coupling capacitor. This will shift the oscillation into the audible spectrum, creating a custom tone generator.

More Practical Cases on Prometeo.blog

Find this product and/or books on this topic on Amazon

Go to Amazon

As an Amazon Associate, I earn from qualifying purchases. If you buy through this link, you help keep this project running.

Quick Quiz

Question 1: What is the primary objective of the circuit described in the text?


Question 2: Between what two voltage levels does the timing capacitor continuously charge and discharge?


Question 3: What is the expected flashing frequency of the LED connected to the output?


Question 4: What type of signal does the circuit generate without requiring an external trigger?


Question 5: Which of the following is listed as a use case for this NE555 circuit?


Question 6: What role does the timing capacitor play in this NE555 circuit?


Question 7: How does the circuit behave in terms of triggering?


Question 8: What foundational principle does this astable multivibrator circuit demonstrate?


Question 9: In hazard and warning systems, what is the NE555 circuit used to drive?


Question 10: What does the circuit generate for sequential digital circuits?


Carlos Núñez Zorrilla
Electronics & Computer Engineer

Telecommunications Electronics Engineer and Computer Engineer (official degrees in Spain).
Follow me:


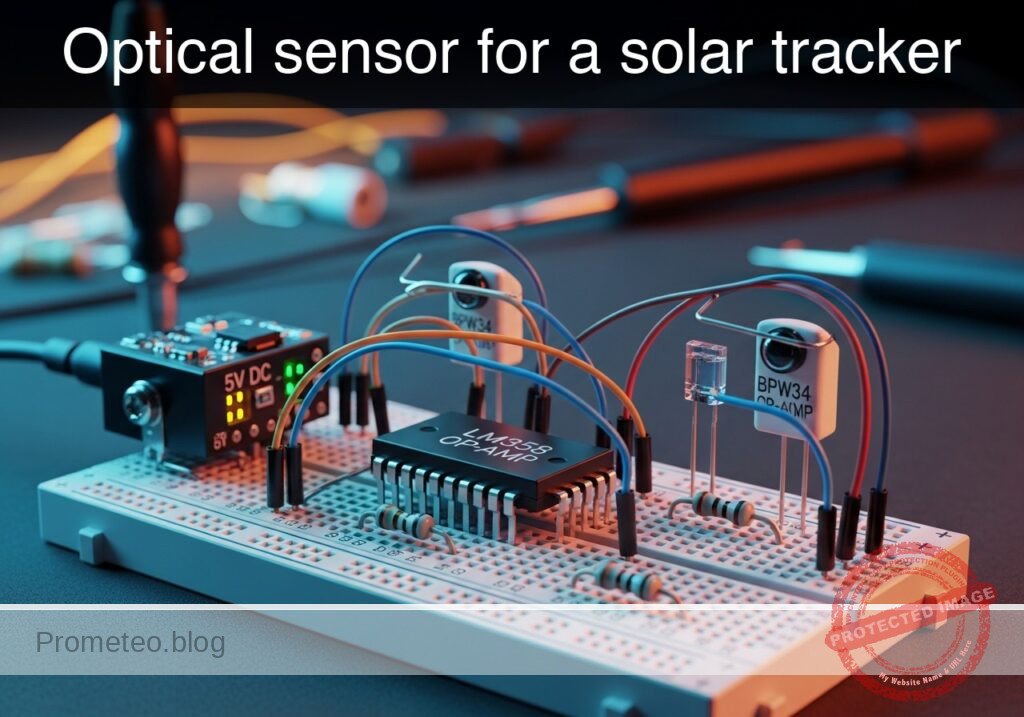
Practical case: Optical sensor for a solar tracker

Optical sensor for a solar tracker prototype (Maker Style)

Level: Medium – Design a circuit with two photodiodes in a differential configuration to detect the direction of the highest intensity light source.

Objective and use case

You will build a directional light-sensing circuit that uses two reverse-biased photodiodes and an operational amplifier acting as a voltage comparator. By measuring the difference in light intensity between the two sensors, the circuit determines which side is receiving more light.

Why this circuit is useful:
* Maximizing solar panel efficiency by keeping them aimed directly at the sun.
* Enabling autonomous robots to seek out light sources for navigation or charging.
* Automating smart home systems, such as blinds or awnings, to react to direct sunlight direction.

Expected outcome:
* A measurable differential voltage representing the light imbalance between the two sensors.
* Reverse currents through each photodiode strictly proportional to the light hitting them.
* A distinct switching threshold on the operational amplifier’s output based on which sensor yields a higher voltage.
* An LED indicator that clearly illuminates when the left sensor receives more light than the right sensor.

Target audience and level: Intermediate electronics students learning about analog comparators, optoelectronics, and differential measurement.

Materials

  • V1: 5 V DC supply
  • D1: BPW34 photodiode, function: left light sensor (reverse-biased)
  • D2: BPW34 photodiode, function: right light sensor (reverse-biased)
  • R1: 100 kΩ resistor, function: D1 load (current-to-voltage conversion)
  • R2: 100 kΩ resistor, function: D2 load (current-to-voltage conversion)
  • U1: LM358 operational amplifier, function: voltage comparator
  • R3: 330 Ω resistor, function: LED current limiting
  • D3: red LED, function: left-direction indicator

Wiring guide

  • V1 connects between VCC and 0.
  • D1 connects between VCC (cathode) and VL (anode).
  • R1 connects between VL and 0.
  • D2 connects between VCC (cathode) and VR (anode).
  • R2 connects between VR and 0.
  • U1 positive power supply pin connects to VCC.
  • U1 negative power supply pin connects to 0.
  • U1 non-inverting input (IN+) connects to VL.
  • U1 inverting input (IN-) connects to VR.
  • U1 output connects to node VOUT.
  • R3 connects between VOUT and VLED.
  • D3 connects between VLED (anode) and 0 (cathode).

Conceptual block diagram

Conceptual block diagram — LM358 LM358 Comparator
Quick read: inputs → main block → output (actuator or measurement). This summarizes the ASCII schematic below.

Schematic

VCC --> [ D1: BPW34 Left ] ---(Node VL)--> [ R1: 100 kΩ ] --> GND
                                  |
                                  +-----(IN+)-----> [             ]
                                                    [ U1: LM358   ]
                                                    [ Comparator  ] --(VOUT)--> [ R3: 330 Ω ] --(VLED)--> [ D3: Red LED ] --> GND
                                  +-----(IN-)-----> [             ]
                                  |
VCC --> [ D2: BPW34 Right ] --(Node VR)--> [ R2: 100 kΩ ] --> GND
Electrical Schematic

Electrical diagram

Electrical diagram for case: Optical sensor for a solar tracker
Generated from the validated SPICE netlist for this case.

🔒 This electrical diagram is premium. With the monthly membership (7-day free trial) you can unlock the complete didactic material and the print-ready PDF pack.🔓 See premium access plans

Measurements and tests

  1. Reverse Current Verification: Measure the DC voltage drops across R1 and R2. Calculate the reverse photocurrent using Ohm’s Law ($I = V/R$). Ensure the current increases linearly as you move a flashlight closer to the respective photodiode.
  2. Differential Voltage Measurement: Place a multimeter probe on VL and the other on VR. Shine a light evenly between both sensors; the differential voltage should be near 0 V. Move the light to the left, and the differential voltage should become positive. Move it to the right, and it should become negative.
  3. Switching Threshold Observation: Slowly move a light source from right to left across the sensors. Monitor VOUT with a multimeter or oscilloscope. The output should sharply transition from near 0 V (Low) to roughly 3.5 V–4 V (High) precisely when VL > VR.

SPICE netlist and simulation

Reference SPICE Netlist (ngspice) — excerptFull SPICE netlist (ngspice)

* Optical sensor for a solar tracker
.width out=256

* Power Supply
V1 VCC 0 5V

* Left Light Sensor (D1 and load R1)
* D1 is reverse-biased. I1 simulates the photocurrent generated by light exposure.
D1 VL VCC BPW34
I1 VCC VL PULSE(1u 20u 0 1u 1u 50u 100u)
R1 VL 0 100k

* Right Light Sensor (D2 and load R2)
* D2 is reverse-biased. I2 simulates the photocurrent generated by light exposure.
D2 VR VCC BPW34
I2 VCC VR PULSE(2u 21u 0 1u 1u 100u 200u)
R2 VR 0 100k

* Voltage Comparator (LM358)
XU1 VL VR VCC 0 VOUT LM358
* ... (truncated in public view) ...

Copy this content into a .cir file and run with ngspice.

🔒 Part of this section is premium. With the monthly membership (7-day free trial) you can access the full content (materials, wiring, detailed build, validation, troubleshooting, variants and checklist) and download the complete print-ready PDF pack.

* Optical sensor for a solar tracker
.width out=256

* Power Supply
V1 VCC 0 5V

* Left Light Sensor (D1 and load R1)
* D1 is reverse-biased. I1 simulates the photocurrent generated by light exposure.
D1 VL VCC BPW34
I1 VCC VL PULSE(1u 20u 0 1u 1u 50u 100u)
R1 VL 0 100k

* Right Light Sensor (D2 and load R2)
* D2 is reverse-biased. I2 simulates the photocurrent generated by light exposure.
D2 VR VCC BPW34
I2 VCC VR PULSE(2u 21u 0 1u 1u 100u 200u)
R2 VR 0 100k

* Voltage Comparator (LM358)
XU1 VL VR VCC 0 VOUT LM358

* Left-Direction Indicator LED
R3 VOUT VLED 330
D3 VLED 0 DLED

* Component Models
.model BPW34 D(IS=5e-10 RS=10 N=1)
.model DLED D(IS=1e-19 N=1.6 RS=10)

* LM358 Operational Amplifier Behavioral Subcircuit (Comparator Mode)
.subckt LM358 in_plus in_minus vcc v_ee out
* Smooth continuous switching to ensure convergence, output swings to VCC - 1.2V
B1 out_ideal 0 V = V(v_ee) + (V(vcc) - V(v_ee) - 1.2) * (0.5 + 0.5 * tanh(1000 * (V(in_plus) - V(in_minus))))
Rout out_ideal out 50
.ends

* Simulation Directives
.op
.tran 1u 400u
.print tran V(VL) V(VR) V(VOUT) V(VLED)
.end
* --- GPT review (BOM/Wiring/SPICE) ---
* circuit_ok=true
* simulation_summary: The simulation shows the circuit acting as a comparator. When the left sensor voltage (VL) is higher than the right sensor voltage (VR), the output (VOUT) goes high (approx 3.5V) and the LED turns on (VLED approx 1.65V). When VR is higher than VL, VOUT goes low (0V) and the LED turns off. This matches the expected behavior of a solar tracker optical sensor.
* bom_vs_spice equivalences ignored:
*   - LM358 operational amplifier is modeled using a behavioral subcircuit (comparator mode).
*   - Photodiodes D1 and D2 are modeled with BPW34 diode models and parallel PULSE current sources (I1, I2) to simulate photocurrent.
*   - Red LED D3 is modeled as a standard diode with a specific model (DLED).
* overall_comment: The SPICE netlist accurately reflects the BOM and wiring guide. The use of current sources to simulate photocurrent in reverse-biased photodiodes is an excellent didactic approach. The behavioral model for the LM358 works well to demonstrate the comparator function. The circuit is fully functional and serves as a great practical example for students.
* --------------------------------------

Simulation Results (Transient Analysis)

Simulation Results (Transient Analysis)

Analysis: The simulation shows the circuit acting as a comparator. When the left sensor voltage (VL) is higher than the right sensor voltage (VR), the output (VOUT) goes high (approx 3.5V) and the LED turns on (VLED approx 1.65V). When VR is higher than VL, VOUT goes low (0V) and the LED turns off. This matches the expected behavior of a solar tracker optical sensor.
Show raw data table (464 rows)
Index   time            v(vl)           v(vr)           v(vout)         v(vled)
0	0.000000e+00	1.000505e-01	2.000505e-01	2.554194e-49	1.941187e-48
1	1.000000e-08	1.190505e-01	2.190505e-01	2.407063e-64	1.829368e-63
2	2.000000e-08	1.380505e-01	2.380505e-01	-2.40706e-64	-1.82937e-63
3	4.000000e-08	1.760505e-01	2.760505e-01	-1.13420e-78	-8.61995e-78
4	8.000000e-08	2.520505e-01	3.520505e-01	4.536814e-79	3.447978e-78
5	1.600000e-07	4.040505e-01	5.040504e-01	3.420381e-93	2.599489e-92
6	3.200000e-07	7.080504e-01	8.080504e-01	-8.55095e-94	-6.49872e-93
7	6.400000e-07	1.316050e+00	1.416050e+00	-8.86422e-108	-6.73681e-107
8	1.000000e-06	2.000050e+00	2.100050e+00	9.065683e-109	6.889919e-108
9	1.064000e-06	2.000050e+00	2.100050e+00	2.491317e-123	1.893401e-122
10	1.192000e-06	2.000050e+00	2.100050e+00	-1.70869e-123	-1.29861e-122
11	1.448000e-06	2.000050e+00	2.100050e+00	-9.52641e-138	-7.24007e-137
12	1.960000e-06	2.000050e+00	2.100050e+00	3.220532e-138	2.447604e-137
13	2.960000e-06	2.000050e+00	2.100050e+00	2.649727e-152	2.013792e-151
14	3.960000e-06	2.000050e+00	2.100050e+00	-3.03502e-153	-2.30661e-152
15	4.960000e-06	2.000050e+00	2.100050e+00	-3.06913e-167	-2.33254e-166
16	5.960000e-06	2.000050e+00	2.100050e+00	2.860189e-168	2.173743e-167
17	6.960000e-06	2.000050e+00	2.100050e+00	3.431423e-182	2.607881e-181
18	7.960000e-06	2.000050e+00	2.100050e+00	-2.69543e-183	-2.04853e-182
19	8.960000e-06	2.000050e+00	2.100050e+00	-3.74179e-197	-2.84376e-196
20	9.960000e-06	2.000050e+00	2.100050e+00	2.540164e-198	1.930525e-197
21	1.096000e-05	2.000050e+00	2.100050e+00	4.005019e-212	3.043815e-211
22	1.196000e-05	2.000050e+00	2.100050e+00	-2.39384e-213	-1.81932e-212
23	1.296000e-05	2.000050e+00	2.100050e+00	-4.22550e-227	-3.21138e-226
... (440 more rows) ...


Reference SPICE netlist (ngspice)

* Optical sensor for a solar tracker
.width out=256

* Power Supply
V1 VCC 0 5V

* Left Light Sensor (D1 and load R1)
* D1 is reverse-biased. I1 simulates the photocurrent generated by light exposure.
D1 VL VCC BPW34
I1 VCC VL PULSE(1u 20u 0 1u 1u 50u 100u)
R1 VL 0 100k

* Right Light Sensor (D2 and load R2)
* D2 is reverse-biased. I2 simulates the photocurrent generated by light exposure.
D2 VR VCC BPW34
I2 VCC VR PULSE(2u 21u 0 1u 1u 100u 200u)
R2 VR 0 100k

* Voltage Comparator (LM358)
XU1 VL VR VCC 0 VOUT LM358

* Left-Direction Indicator LED
R3 VOUT VLED 330
D3 VLED 0 DLED

* Component Models
.model BPW34 D(IS=5e-10 RS=10 N=1)
.model DLED D(IS=1e-19 N=1.6 RS=10)

* LM358 Operational Amplifier Behavioral Subcircuit (Comparator Mode)
.subckt LM358 in_plus in_minus vcc v_ee out
* Smooth continuous switching to ensure convergence, output swings to VCC - 1.2V
B1 out_ideal 0 V = V(v_ee) + (V(vcc) - V(v_ee) - 1.2) * (0.5 + 0.5 * tanh(1000 * (V(in_plus) - V(in_minus))))
Rout out_ideal out 50
.ends

* Simulation Directives
.op
.tran 1u 400u
.print tran V(VL) V(VR) V(VOUT) V(VLED)
.end
* --- GPT review (BOM/Wiring/SPICE) ---
* circuit_ok=true
* simulation_summary: The simulation shows the circuit acting as a comparator. When the left sensor voltage (VL) is higher than the right sensor voltage (VR), the output (VOUT) goes high (approx 3.5V) and the LED turns on (VLED approx 1.65V). When VR is higher than VL, VOUT goes low (0V) and the LED turns off. This matches the expected behavior of a solar tracker optical sensor.
* bom_vs_spice equivalences ignored:
*   - LM358 operational amplifier is modeled using a behavioral subcircuit (comparator mode).
*   - Photodiodes D1 and D2 are modeled with BPW34 diode models and parallel PULSE current sources (I1, I2) to simulate photocurrent.
*   - Red LED D3 is modeled as a standard diode with a specific model (DLED).
* overall_comment: The SPICE netlist accurately reflects the BOM and wiring guide. The use of current sources to simulate photocurrent in reverse-biased photodiodes is an excellent didactic approach. The behavioral model for the LM358 works well to demonstrate the comparator function. The circuit is fully functional and serves as a great practical example for students.
* --------------------------------------

Simulation Results (Transient Analysis)

Simulation Results (Transient Analysis)

Analysis: The simulation shows the circuit acting as a comparator. When the left sensor voltage (VL) is higher than the right sensor voltage (VR), the output (VOUT) goes high (approx 3.5V) and the LED turns on (VLED approx 1.65V). When VR is higher than VL, VOUT goes low (0V) and the LED turns off. This matches the expected behavior of a solar tracker optical sensor.

Common mistakes and how to avoid them

  • Forward-biasing the photodiodes: Photodiodes must be reverse-biased to act as light-dependent current sources. If the anode is connected to VCC, the diode will conduct heavily like a standard diode, bypassing the light-sensing capability. Always ensure the cathode connects to the positive supply.
  • Using load resistors that are too small: A photodiode’s reverse current is typically in the microampere (µA) range. If R1 and R2 are too low (e.g., 1 kΩ), the resulting voltage drop will be too small for the comparator to reliably measure. Stick to high values like 100 kΩ or 1 MΩ.
  • Lack of optical separation: If both sensors are placed flat next to each other without an optical barrier (a small piece of opaque plastic separating their fields of view), they will receive almost identical light regardless of the angle, preventing the differential circuit from working.

Troubleshooting

  • Symptom: VOUT constantly fluctuates or the LED flickers continuously.
    • Cause: The sensors are picking up the 50 Hz / 60 Hz flicker from indoor AC lighting, causing the comparator to oscillate.
    • Fix: Add a small capacitor (e.g., 100 nF) in parallel with R1 and R2 to act as a low-pass filter, or test the circuit using a DC light source like a flashlight or natural sunlight.
  • Symptom: The LED never turns on, even when D1 is flooded with light.
    • Cause: The LM358 output voltage might not be high enough to overcome the LED’s forward voltage plus the voltage drop of R3, or the LED is installed backward.
    • Fix: Verify the LED polarity (anode to R3, cathode to 0). Measure VOUT to ensure it reaches at least 2 V when VL > VR.
  • Symptom: Both VL and VR remain near 0 V regardless of light.
    • Cause: The photodiodes might be installed backward (blocking current entirely), or the light intensity is significantly too low for the chosen load resistors.
    • Fix: Double-check the photodiode orientation. If correct, increase the value of R1 and R2 to 470 kΩ or 1 MΩ to increase sensitivity.

Possible improvements and extensions

  • Add Hysteresis: Introduce a high-value feedback resistor (e.g., 1 MΩ) from VOUT to the non-inverting input (VL). This prevents rapid, noisy switching (chattering) when the light source is perfectly balanced in the center.
  • Motor Driver Integration: Replace the indicator LED with an H-bridge motor driver (like an L298N or L293D). This allows the circuit to physically drive a DC motor to rotate a platform, creating a fully functional 1-axis physical solar tracker.

More Practical Cases on Prometeo.blog

Find this product and/or books on this topic on Amazon

Go to Amazon

As an Amazon Associate, I earn from qualifying purchases. If you buy through this link, you help keep this project running.

Quick Quiz

Question 1: What is the primary function of the operational amplifier in this circuit?


Question 2: How are the photodiodes configured in this directional light-sensing circuit?


Question 3: What is the specific purpose of the 100 kΩ resistors (R1 and R2)?


Question 4: Under what condition does the LED indicator clearly illuminate?


Question 5: Which specific photodiode model is used for the light sensors in the materials list?


Question 6: What is one of the mentioned use cases for this directional light-sensing circuit?


Question 7: What does the reverse current through each photodiode strictly depend on?


Question 8: What is the target audience and level for this circuit project?


Question 9: What is the role of resistor R3 (330 Ω) in the circuit?


Question 10: What is the voltage of the DC supply (V1) used in this circuit?


Carlos Núñez Zorrilla
Electronics & Computer Engineer

Telecommunications Electronics Engineer and Computer Engineer (official degrees in Spain).
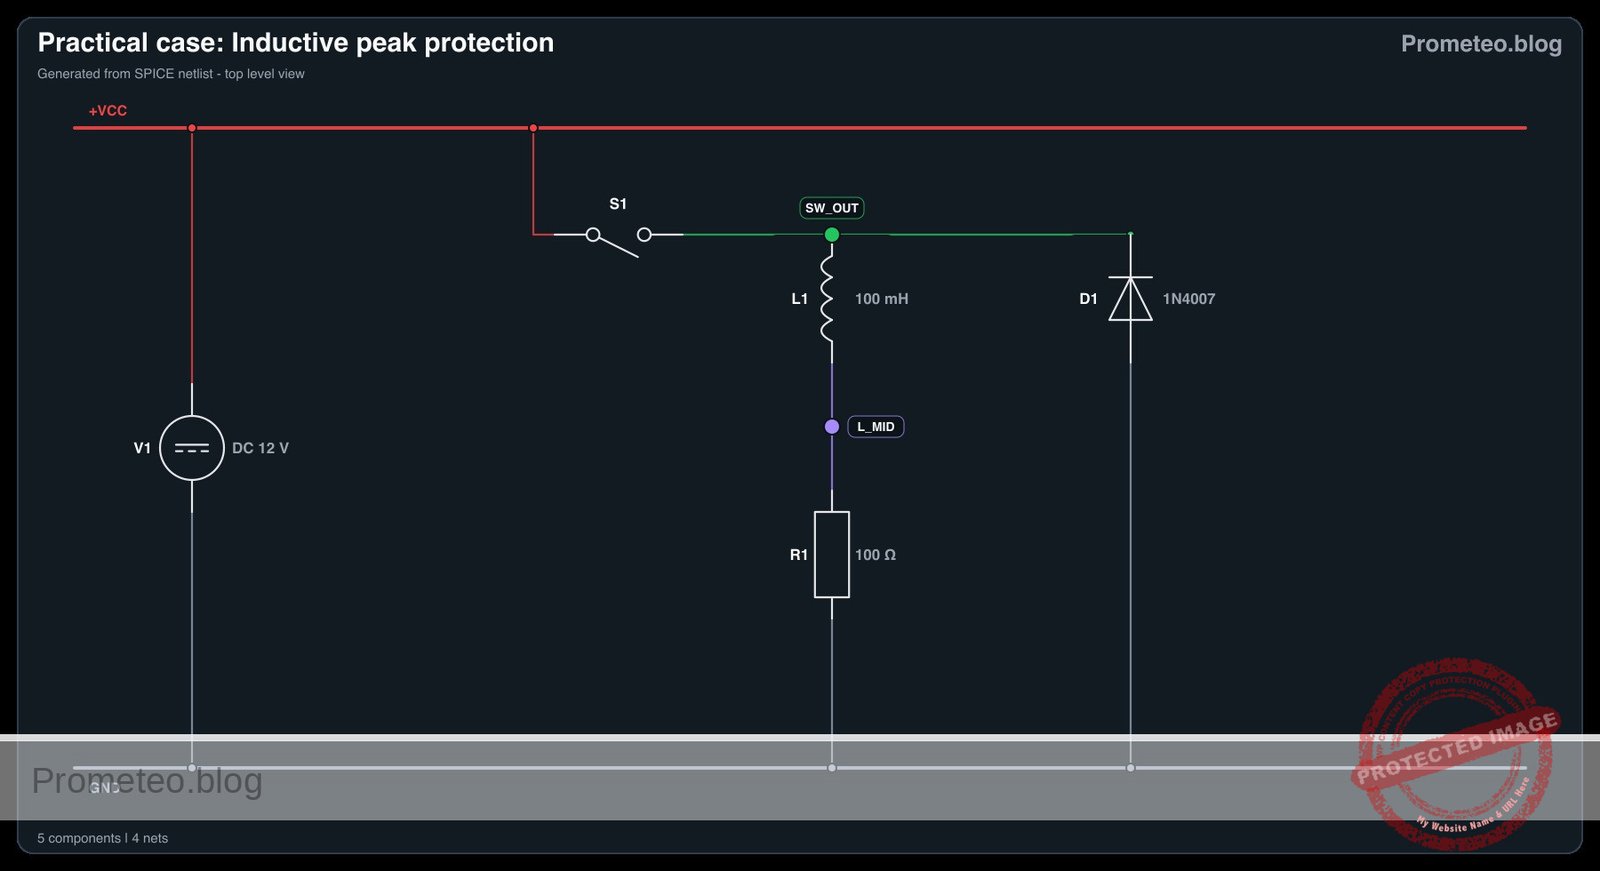
Follow me: