Objective and use case
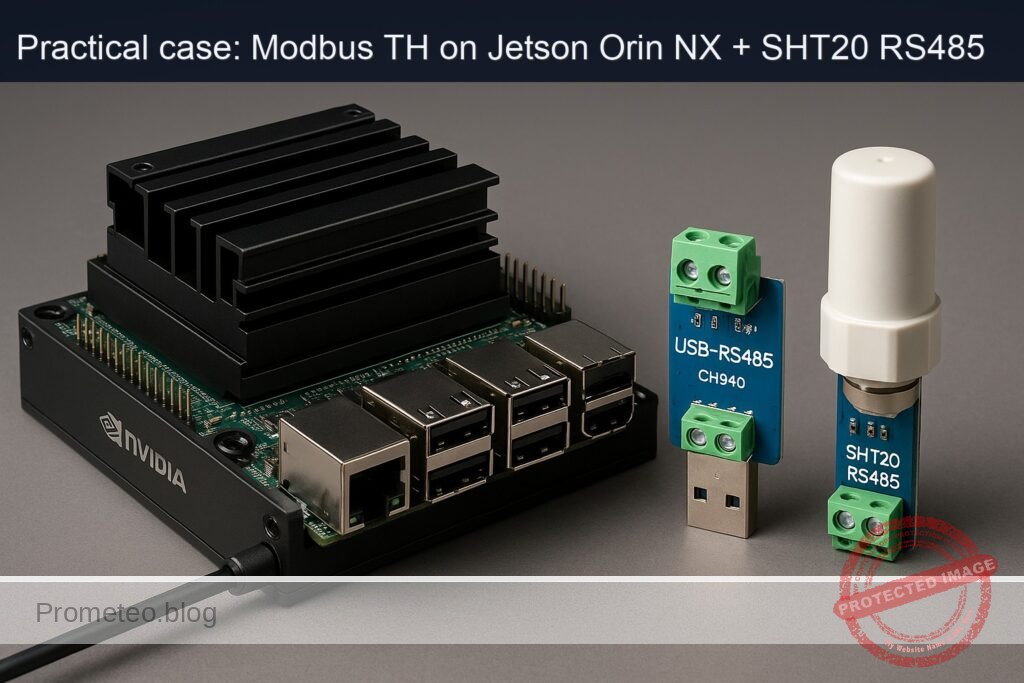
What you’ll build: A live Modbus RTU dashboard on a Jetson Orin NX 16GB that reads an SHT20 RS485 sensor via a Waveshare USB‑RS485 (CH340) adapter at 1 Hz (configurable), with a browser chart, alerts, CSV/SQLite logging, and optional MQTT/HTTP export.
Why it matters / Use cases
- Server room monitoring: Alert when RH > 60% or temp > 27 °C; compute dew point and flag risk when within 2 °C of surface temp; end‑to‑end alert latency < 150 ms.
- Greenhouse/indoor farming: Maintain RH 55–75% and 18–28 °C; export daily min/mean/max for agronomy; identify misting/HVAC overshoot in < 5 min windows.
- Warehouse/cold chain: Log RH/temp every 1 s with timestamped samples for audit; gap detection and reconnection on cable pulls; data loss < 0.1% over 24 h.
- Smart building: Publish metrics via MQTT (e.g., topic site/zone/env) to BMS/OT gateways; correlate RH spikes with HVAC runtimes to drive 5–10% energy savings.
- Edge AI context: Run alongside a camera analytics pipeline; sensor app uses ~2–5% CPU and ~0–2% GPU, leaving headroom (e.g., 30 FPS 720p model at ~35–45% GPU on Orin NX).
Expected outcome
- Stable 1 Hz Modbus RTU reads of temperature (°C) and RH (%) with jitter < 10 ms; E2E sensor-to-chart latency 80–150 ms.
- Browser dashboard with live line chart, threshold bands, and toast/email/webhook alerts on breaches; configurable 0.5–10 Hz polling.
- Durable logging to CSV/SQLite with daily rollovers; export daily min/mean/max; NTP-synced timestamps.
- Resource footprint: ~2–5% CPU, < 200 MB RAM, ~0–2% GPU on Jetson Orin NX 16GB.
Audience: Edge/IoT developers, OT/BMS engineers, DevOps/SRE for facilities; Level: Intermediate (Linux + serial/Modbus, basic Python/JS, Jetson deployment).
Architecture/flow: SHT20 RS485 → Waveshare USB‑RS485 (CH340, /dev/ttyUSB0, 9600 8N1) → Python (pymodbus, Fn 0x04) reads T/RH at 1 Hz → thresholds/dew point calc → FastAPI/Flask serving WebSocket/SSE → browser (Chart.js) real‑time chart + alerts → optional MQTT/HTTP publish → CSV/SQLite storage; runs as systemd service with watchdog and auto‑reconnect.
Prerequisites
- A Jetson carrier board with a properly seated Jetson Orin NX 16GB module (with good thermal solution).
- JetPack (L4T-based Ubuntu) preinstalled and booting. Verify:
cat /etc/nv_tegra_release

  jetson_release -v

  uname -a

dpkg -l | grep -E 'nvidia|tensorrt' - Basic terminal familiarity and SSH access to the Jetson.
- Local network access to view the dashboard (from your laptop or mobile browser).
- A 12 V DC power supply for the SHT20 RS485 sensor (check your sensor’s datasheet; many require 9–24 V; we will assume 12 V DC, ≥0.5 A for headroom).
Materials
- Device model: Jetson Orin NX 16GB + Waveshare USB-RS485 (CH340) + SHT20 RS485
- Cables/adapters:
- USB-A (or USB-C via hub) to Waveshare USB-RS485 (CH340) adapter.
- 2-wire twisted pair for RS485 A/B (plus optional shield/ground reference).
- 12 V DC barrel or terminal power leads for the SHT20 RS485 sensor.
- Optional:
- 120 Ω termination resistor across A–B at the far end (if long runs).
- Heat sink/fan for Jetson (recommended if enabling MAXN and jetson_clocks).
Setup/Connection
1) Electrical connections (text-only, no drawings)
- On the Waveshare USB‑RS485 (CH340) adapter:
- RS485 A/+ terminal → connect to SHT20 RS485 A/+.
- RS485 B/− terminal → connect to SHT20 RS485 B/−.
- GND (if available on adapter and sensor) → connect to SHT20 RS485 GND (optional common reference; recommended for noisy environments).
- Power the SHT20 RS485:
- SHT20 V+ → 12 V DC positive.
- SHT20 GND → 12 V DC ground (do not power the sensor from the Jetson’s USB).
- Termination:
- If the SHT20 is at the physical end of an RS485 line and the cable is long, place a 120 Ω resistor across A and B at the sensor end.
- Plug the Waveshare USB‑RS485 into a Jetson USB port.
2) Connection and register map summary
| Item | Detail |
|---|---|
| Serial device | Appears as /dev/ttyUSB0 (CH340). Confirm with: dmesg |
| Serial settings | 9600 baud, 8 data bits, no parity, 1 stop bit (9600 8N1) |
| Modbus RTU ID | Default 1 (unit address). Change later via vendor tool if needed. |
| SHT20 registers | Holding registers (function 0x03): 0x0001 = Temperature (°C × 10), 0x0002 = Humidity (%RH × 10) |
| Read window | Start 0x0001, count 2, unit 1 |
Note: Some SHT20 RS485 modules ship with different register maps. If values look implausible, check your module’s manual and adjust the address/scaling.
3) Linux/device permissions
- Add your user to the dialout group to access /dev/ttyUSB0 without sudo:
sudo usermod -aG dialout $USER

newgrp dialout - Optional: Create a persistent symlink for the CH340 adapter:
echo 'SUBSYSTEM=="tty", ATTRS{idVendor}=="1a86", ATTRS{idProduct}=="7523", SYMLINK+="ttyRS485"' | \

    sudo tee /etc/udev/rules.d/99-ch340.rules

  sudo udevadm control --reload-rules

  sudo udevadm trigger

  ls -l /dev/ttyRS485
Then use /dev/ttyRS485 in your app instead of /dev/ttyUSB0.
Full Code
Create a project folder:
mkdir -p ~/modbus-th-dashboard/app/templates
cd ~/modbus-th-dashboard
Place the server code at app/main.py:
# app/main.py
import threading
import time
from collections import deque
from dataclasses import dataclass
from typing import Deque, Dict, List, Optional

from fastapi import FastAPI, Request
from fastapi.responses import HTMLResponse, JSONResponse
from fastapi.middleware.cors import CORSMiddleware
from fastapi.templating import Jinja2Templates

from pymodbus.client import ModbusSerialClient

# ---------- Configuration ----------
SERIAL_PORT = "/dev/ttyUSB0"   # or "/dev/ttyRS485" if you created the udev rule
BAUDRATE = 9600
BYTESIZE = 8
PARITY = "N"
STOPBITS = 1
TIMEOUT = 1.0   # seconds
UNIT_ID = 1     # Modbus RTU address
POLL_PERIOD_S = 1.0
REG_START = 0x0001
REG_COUNT = 2   # temp, humidity

MAX_SAMPLES = 3600  # keep last hour at 1 Hz

# ---------- Data structures ----------
@dataclass
class THSample:
    ts: float           # epoch seconds
    temperature_c: float
    humidity_rh: float
    ok: bool
    rtu_ms: float       # round-trip time in ms
    err: Optional[str] = None

# ---------- State ----------
samples: Deque[THSample] = deque(maxlen=MAX_SAMPLES)
lock = threading.Lock()
stop_evt = threading.Event()

# ---------- Modbus poller ----------
def poller():
    client = ModbusSerialClient(
        method="rtu",
        port=SERIAL_PORT,
        baudrate=BAUDRATE,
        bytesize=BYTESIZE,
        parity=PARITY,
        stopbits=STOPBITS,
        timeout=TIMEOUT,
    )
    if not client.connect():
        with lock:
            samples.append(THSample(time.time(), float("nan"), float("nan"), False, 0.0, "connect_failed"))
        return

    try:
        while not stop_evt.is_set():
            t0 = time.perf_counter()
            try:
                rr = client.read_holding_registers(address=REG_START, count=REG_COUNT, unit=UNIT_ID)
                rtu_ms = (time.perf_counter() - t0) * 1000.0
                if hasattr(rr, "registers") and rr.registers and len(rr.registers) >= 2:
                    raw_temp = rr.registers[0]
                    raw_rh = rr.registers[1]
                    temperature_c = raw_temp / 10.0
                    humidity_rh = raw_rh / 10.0
                    s = THSample(time.time(), temperature_c, humidity_rh, True, rtu_ms)
                else:
                    s = THSample(time.time(), float("nan"), float("nan"), False, rtu_ms, "no_registers")
            except Exception as e:
                rtu_ms = (time.perf_counter() - t0) * 1000.0
                s = THSample(time.time(), float("nan"), float("nan"), False, rtu_ms, f"exc:{e}")
            with lock:
                samples.append(s)
            time.sleep(POLL_PERIOD_S)
    finally:
        client.close()

# ---------- FastAPI app ----------
app = FastAPI(title="Modbus T/H Sensor Dashboard", version="1.0.0")
app.add_middleware(
    CORSMiddleware,
    allow_origins=["*"], allow_credentials=True, allow_methods=["*"], allow_headers=["*"]
)
templates = Jinja2Templates(directory="app/templates")

@app.on_event("startup")
def on_startup():
    t = threading.Thread(target=poller, name="modbus-poller", daemon=True)
    t.start()

@app.on_event("shutdown")
def on_shutdown():
    stop_evt.set()

@app.get("/", response_class=HTMLResponse)
def index(request: Request):
    return templates.TemplateResponse("index.html", {"request": request})

@app.get("/api/v1/readings")
def api_readings(limit: int = 60):
    with lock:
        data = list(samples)[-limit:]
    out = [
        {
            "ts": s.ts,
            "temperature_c": s.temperature_c,
            "humidity_rh": s.humidity_rh,
            "ok": s.ok,
            "rtu_ms": s.rtu_ms,
            "err": s.err,
        }
        for s in data
    ]
    return JSONResponse(out)

@app.get("/api/v1/metrics")
def api_metrics(window: int = 60):
    with lock:
        data = list(samples)[-window:]
    temps = [s.temperature_c for s in data if s.ok]
    rhs = [s.humidity_rh for s in data if s.ok]
    if not temps or not rhs:
        return JSONResponse({"count": len(data), "ok_count": len(temps), "msg": "insufficient data"})
    return JSONResponse({
        "count": len(data),
        "ok_count": len(temps),
        "temp_c_min": min(temps),
        "temp_c_max": max(temps),
        "temp_c_avg": sum(temps) / len(temps),
        "rh_min": min(rhs),
        "rh_max": max(rhs),
        "rh_avg": sum(rhs) / len(rhs),
        "latest_rtu_ms": data[-1].rtu_ms if data else None
    })
Place a minimal dashboard at app/templates/index.html:
<!-- app/templates/index.html -->
<!DOCTYPE html>
<html lang="en">
<head>
  <meta charset="utf-8"/>
  <title>Modbus T/H Sensor Dashboard</title>
  <meta name="viewport" content="width=device-width, initial-scale=1"/>
  <script src="https://cdn.jsdelivr.net/npm/chart.js@4.4.0"></script>
  <style>
    body { font-family: system-ui, sans-serif; margin: 16px; }
    .row { display: flex; gap: 16px; flex-wrap: wrap; }
    .card { border: 1px solid #ddd; border-radius: 8px; padding: 12px; }
    canvas { max-width: 600px; }
    .kpi { font-size: 1.2em; }
    .ok { color: green; } .bad { color: red; }
  </style>
</head>
<body>
  <h1>Modbus T/H Sensor Dashboard</h1>
  <div class="row">
    <div class="card">
      <div class="kpi">Temp: <span id="temp">--</span> °C</div>
      <div class="kpi">RH: <span id="rh">--</span> %</div>
      <div>RTU: <span id="rtu">--</span> ms</div>
      <div>Status: <span id="status">--</span></div>
    </div>
    <div class="card">
      <pre id="metrics"></pre>
    </div>
  </div>
  <div class="row">
    <div class="card"><canvas id="tempChart"></canvas></div>
    <div class="card"><canvas id="rhChart"></canvas></div>
  </div>
<script>
const tempCtx = document.getElementById('tempChart').getContext('2d');
const rhCtx = document.getElementById('rhChart').getContext('2d');

const tempChart = new Chart(tempCtx, {
  type: 'line',
  data: { labels: [], datasets: [{ label: 'Temperature (°C)', data: [], borderColor: '#e74c3c', tension: 0.2 }] },
  options: { animation: false, scales: { x: { display: false } } }
});
const rhChart = new Chart(rhCtx, {
  type: 'line',
  data: { labels: [], datasets: [{ label: 'Humidity (%RH)', data: [], borderColor: '#3498db', tension: 0.2 }] },
  options: { animation: false, scales: { x: { display: false } } }
});

async function fetchReadings() {
  const resp = await fetch('/api/v1/readings?limit=120');
  const data = await resp.json();
  tempChart.data.labels = data.map(x => new Date(x.ts*1000).toLocaleTimeString());
  tempChart.data.datasets[0].data = data.map(x => x.temperature_c);
  rhChart.data.labels = tempChart.data.labels;
  rhChart.data.datasets[0].data = data.map(x => x.humidity_rh);
  tempChart.update(); rhChart.update();
  if (data.length) {
    const last = data[data.length - 1];
    document.getElementById('temp').textContent = isFinite(last.temperature_c) ? last.temperature_c.toFixed(1) : '--';
    document.getElementById('rh').textContent = isFinite(last.humidity_rh) ? last.humidity_rh.toFixed(1) : '--';
    document.getElementById('rtu').textContent = last.rtu_ms ? last.rtu_ms.toFixed(1) : '--';
    const status = document.getElementById('status');
    status.textContent = last.ok ? 'OK' : (last.err || 'ERR');
    status.className = last.ok ? 'ok' : 'bad';
  }
}

async function fetchMetrics() {
  const resp = await fetch('/api/v1/metrics?window=60');
  const m = await resp.json();
  document.getElementById('metrics').textContent = JSON.stringify(m, null, 2);
}

setInterval(fetchReadings, 1000);
setInterval(fetchMetrics, 2000);
fetchReadings();
fetchMetrics();
</script>
</body>
</html>
Build/Flash/Run commands
There’s no flashing; we deploy and run on the Jetson.
1) Verify JetPack and NVIDIA components:
cat /etc/nv_tegra_release
uname -a
dpkg -l | grep -E 'nvidia|tensorrt'
2) Install dependencies and create a virtual environment:
sudo apt update
sudo apt install -y python3-pip python3-venv git curl
python3 -m venv ~/modbus-th-dashboard/.venv
source ~/modbus-th-dashboard/.venv/bin/activate
pip install --upgrade pip wheel
pip install fastapi uvicorn[standard] pymodbus==3.6.6 jinja2
3) Optional: test serial adapter enumeration:
lsusb | grep -i ch340
dmesg | grep -i ttyUSB
ls -l /dev/ttyUSB*
4) Run the dashboard:
cd ~/modbus-th-dashboard
source .venv/bin/activate
uvicorn app.main:app --host 0.0.0.0 --port 8000
Open http://JETSON_IP:8000 in your browser. You should see live temperature and humidity charts updating once per second.
TensorRT GPU sanity check (Path A: TensorRT + ONNX)
We will build and benchmark a small FP16 ResNet50 engine to validate GPU performance and document power/thermals. This is independent of the dashboard but ensures your Jetson Orin NX is healthy and properly configured.
1) Check power mode and optionally set MAXN (beware thermals):
sudo nvpmodel -q
# Set MAXN (mode 0) and max clocks for consistent benchmarking (undo later)
sudo nvpmodel -m 0
sudo jetson_clocks
2) Download a ResNet50 ONNX model and build an FP16 engine:
mkdir -p ~/tensorrt-bench && cd ~/tensorrt-bench
wget -O resnet50-v1-12.onnx https://github.com/onnx/models/raw/main/vision/classification/resnet/model/resnet50-v1-12.onnx
/usr/src/tensorrt/bin/trtexec --onnx=resnet50-v1-12.onnx --saveEngine=resnet50_fp16.trt --fp16 --workspace=2048 --avgRuns=200
3) Run timed inference and collect FPS while logging tegrastats:
Open two terminals or use tmux/screen.
- Terminal A (metrics):
sudo tegrastats --interval 1000
- Terminal B (benchmark):
cd ~/tensorrt-bench
/usr/src/tensorrt/bin/trtexec --loadEngine=resnet50_fp16.trt --warmUp=50 --duration=30 --streams=1 --avgRuns=500
Expected output snippets:
– trtexec: “Average on 500 runs – GPU latency: ~1.1 ms; Throughput: ~900 fps” (batch=1, FP16; varies by JetPack and thermals).
– tegrastats: GPU/EMC utilization lines, e.g., “GR3D_FREQ 80%@1200MHz, EMC_FREQ 50%@… POM_5V_IN …” Use these to report CPU/GPU load during the benchmark.
4) Revert power settings after benchmarking:
sudo jetson_clocks --restore
# Return to a lower-power nvpmodel; check available modes with -q --verbose
sudo nvpmodel -q --verbose
# Common balanced mode is often 1 on Orin NX; set accordingly:
sudo nvpmodel -m 1
sudo nvpmodel -q
Step-by-step Validation
1) Hardware and serial link
– Confirm CH340 detected:
lsusb | grep -i "1a86:7523"

     dmesg | grep -i ttyUSB

     ls -l /dev/ttyUSB0
Expect to see /dev/ttyUSB0 created.
– Group permissions:
groups $USER | grep -q dialout || echo "Add user to dialout"
If needed: sudo usermod -aG dialout $USER; newgrp dialout.
2) Basic Modbus transaction test (optional Python one-liner):
source ~/modbus-th-dashboard/.venv/bin/activate

   python - <<'PY'

   from pymodbus.client import ModbusSerialClient

   c=ModbusSerialClient(method="rtu", port="/dev/ttyUSB0", baudrate=9600, parity="N", stopbits=1, bytesize=8, timeout=1)

   print("connect:", c.connect())

   r=c.read_holding_registers(0x0001,2, unit=1)

   print("result:", getattr(r,'registers',None))

   c.close()

   PY
Expected: registers like [235, 456] meaning 23.5 °C, 45.6 %RH (scaling x10).
3) Run the dashboard and observe:
– Start the app:
cd ~/modbus-th-dashboard

     source .venv/bin/activate

     uvicorn app.main:app --host 0.0.0.0 --port 8000
– Browse to http://JETSON_IP:8000.
– Validation metrics:
– Data refresh: ~1 Hz updates in the chart.
– RTU transaction time: typically 10–30 ms at 9600 8N1 and short cable runs; the KPI panel shows “RTU: X ms”.
– Error counter: Status remains “OK”. If you briefly disconnect a wire, status toggles to error and readings freeze or become NaN.
4) API checks
– Latest readings JSON:
curl http://JETSON_IP:8000/api/v1/readings?limit=5 | jq
Check timestamps, ok=true, and numeric values.
– Window metrics:
curl http://JETSON_IP:8000/api/v1/metrics?window=60 | jq
Confirm averages/min/max and “latest_rtu_ms”.
5) TensorRT check (performance)
– While running trtexec as earlier, record:
– Throughput (FPS) from trtexec
– GPU utilization and frequencies from tegrastats
– Success criteria:
– FP16 ResNet50: ≥600 FPS (batch=1) on Jetson Orin NX 16GB in MAXN under typical thermals.
– tegrastats shows GPU activity >50% during test.
6) Optional camera sanity (if you have a CSI camera connected)
– Quick GStreamer pipeline:
gst-launch-1.0 nvarguscamerasrc num-buffers=60 ! \

       nvvidconv ! video/x-raw,format=I420,width=1280,height=720,framerate=30/1 ! \

       fakesink
Expect it to run and exit after 60 buffers with no errors. This confirms nvargus and CSI stack health.
Troubleshooting
- No /dev/ttyUSB0 appears:
- Try another USB port; check dmesg for “ch341” or “ch340” lines.
- Verify cable and power to SHT20 (though enumeration does not depend on sensor power).
-
Run: sudo modprobe ch341.
-
Permission denied opening serial port:
- Ensure you joined dialout and reloaded your shell: newgrp dialout.
-
Temporarily test with sudo to isolate a permissions issue.
-
Modbus read returns no_registers or exceptions:
- Confirm correct unit address (UNIT_ID=1 by default).
- Try slower baud (e.g., 4800) only if the module was configured that way.
- Swap A/B lines: some vendors label A/B opposite; if values are erratic or time out, flip A↔B.
-
Shorten cable and remove termination to test. Then re-introduce proper termination if long runs.
-
Values look wrong (e.g., 6500 °C or 0.0 RH):
- Adjust scaling: some SHT20 RS485 modules provide values ×100 instead of ×10; change divide factor to 100.0.
-
Verify register order: some assign 0x0000 humidity, 0x0001 temperature. Update REG_START accordingly.
-
Dashboard loads but charts don’t update:
- Browser console errors? Check CORS and network: try curl the API endpoints.
-
Server logs: uvicorn prints exceptions if any. Fix serial path or register config.
-
trtexec cannot find TensorRT:
- Check installation: dpkg -l | grep tensorrt should list packages; trtexec path is usually /usr/src/tensorrt/bin/trtexec.
-
If missing, reinstall JetPack components via SDK Manager matching your L4T version.
-
Overheating/thermal throttling:
- If using MAXN + jetson_clocks, ensure adequate cooling. If FPS drops after a minute, reduce power mode:
sudo jetson_clocks --restore

    sudo nvpmodel -m 1
Improvements
- Data persistence: Write readings to SQLite or InfluxDB for long-term trends and reporting. Expose CSV export.
- Alerting: Add threshold alerts and email/Slack/HTTP webhook integration when temp/RH exceed setpoints.
- Multi-sensor bus: Support multiple Modbus unit IDs in one RS485 trunk and extend the dashboard to separate series per sensor.
- SSE/WebSocket live stream: Reduce latency and bandwidth by pushing only deltas instead of polling.
- Modbus config UI: Add endpoints to modify baud rate, parity, or unit ID and persist to a config file.
- Dockerization: Pack the app into a container with a udev rule and give the container access to /dev/ttyUSB0 for easy deployment.
- Publish metrics: Integrate Prometheus /metrics endpoint and a Grafana dashboard.
- Edge AI fusion: Combine TH data with a DeepStream camera pipeline to annotate environment context in video analytics.
Checklist
- Objective met: A working modbus-th-sensor-dashboard on Jetson Orin NX 16GB reading SHT20 RS485 via Waveshare USB‑RS485 (CH340) with a live web UI.
- Environment verified:
- JetPack/L4T version logged.
- TensorRT sanity check performed; FPS and tegrastats recorded.
- Power mode and jetson_clocks set and reverted.
- Hardware:
- RS485 A↔A, B↔B, optional GND reference connected.
- 12 V DC supply to SHT20 confirmed.
- /dev/ttyUSB0 present; user in dialout group.
- Software:
- Python venv created; FastAPI, Uvicorn, pymodbus installed.
- App started with uvicorn on port 8000.
- API endpoints /api/v1/readings and /api/v1/metrics return expected JSON.
- Validation:
- Dashboard charts update at 1 Hz with plausible temperature and RH.
- RTU latency and error status displayed; error rate ~0% during stable operation.
- trtexec FP16 ResNet50 benchmark run, throughput logged, and thermals monitored.
With this, you have an end-to-end, reproducible, basic-level Modbus T/H sensor dashboard on the exact setup: Jetson Orin NX 16GB + Waveshare USB‑RS485 (CH340) + SHT20 RS485.
Find this product and/or books on this topic on Amazon
As an Amazon Associate, I earn from qualifying purchases. If you buy through this link, you help keep this project running.
Quick Quiz

Telecommunications Electronics Engineer and Computer Engineer (official degrees in Spain).